market timing model: (Confirmed) Buy
Current signal generated on close of September 9.We are now in confirmed buy mode, so portfolio exposure can be more than 100% if you have a marginable account. However, please make sure that current long positions in your portfolio are working before adding new ones. Portfolio exposure should be at least 75% to 100% (or more) right now.
Past signals:
- Neutral signal generated on close of August 15
- Buy signal generated on close of July 11
- Neutral signal generated on close of July 5
- Sell signal generated on close of June 24
today’s watchlist (potential trade entries):

Having trouble seeing the open positions graphic above? Click here to view it directly on your web browser instead.
open positions:
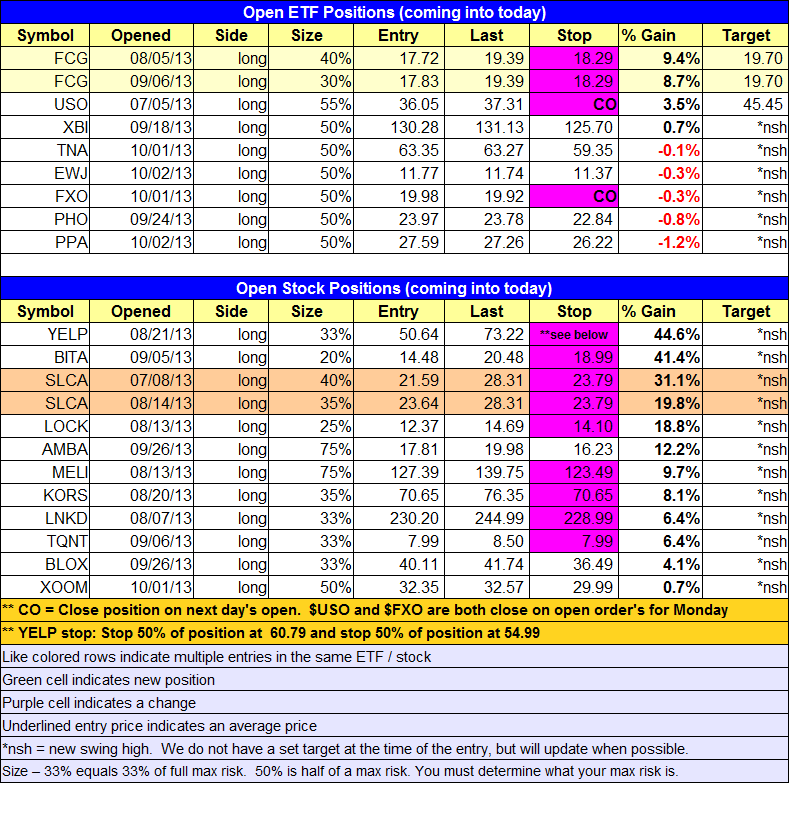
Below is an overview of all open positions, as well as a report on all positions that were closed only since the previous day’s newsletter. Changes to open positions since the previous report are listed in pink shaded cells below. Be sure to read the Wagner Daily subscriber guide for important, automatic rules on trade entries and exits. Click here to learn the best way to calculate your share size.

Having trouble seeing the open positions graphic above? Click here to view it directly on your web browser instead.
closed positions:

Having trouble seeing the closed positions graphic above? Click here to view it directly on your web browser instead.
ETF position notes:
- Selling $USO and $FXO on the open. Note all the changes to stops above.
stock position notes:
- No trades were made. Note all the changes to stops above.
ETF, stock, and broad market commentary:
The major averages closed out the week on a positive note, gaining back most of Thursday’s losses across the board. The NASDAQ Composite, Russell 2000, and S&P 400 remain in great shape, chopping around in a tight range near the swing high and the 10-day moving average. The S&P 500 closed above the rising 50-day MA on Friday. A close above the two-day high will put the blue chip index back above the 10-day, 20-day, and 50-day MAs. The Dow Jones remains a laggard, but has plenty of support just below 15,000, which should spark a decent bounce within the next week or two.
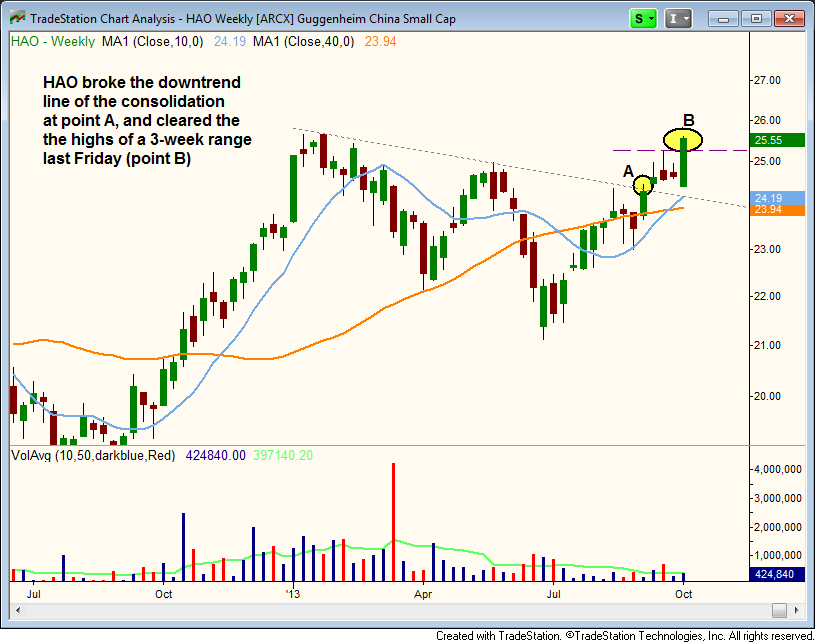
A while back, we discussed a potential breakout in the Claymore/AlphaShares China Small Cap ETF ($HAO), as it bounced higher from a double bottom pattern with a slight undercut of the prior low on the weekly chart below. On Friday, $HAO cleared the highs of a three-week range on better than average volume, signaling the uptrend may be ready to resume after a nine month long consolidation.

We are placing $HAO on the today’s watchlist. Trade details cab be found above. If $HAO triggers, we will look for a move to $30 as the target, which is just below the highs of 2010.
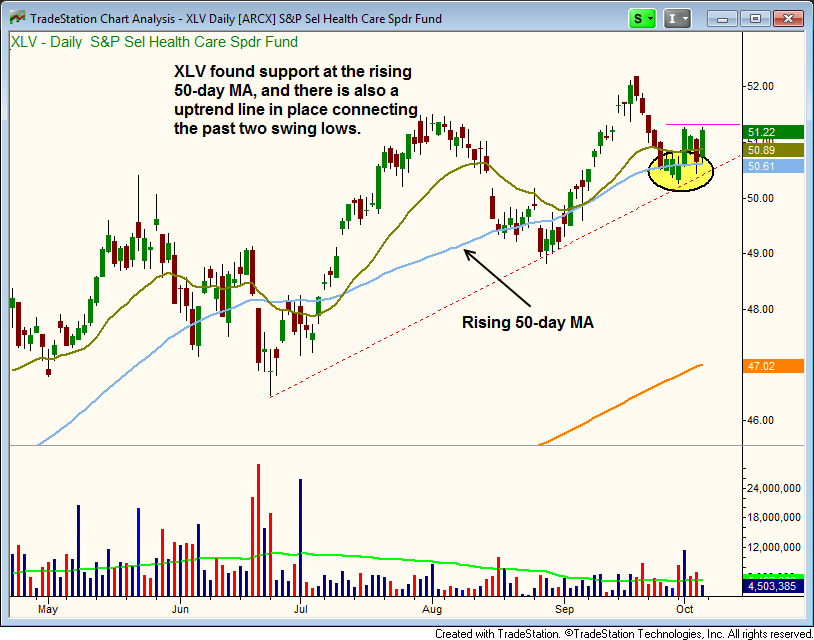
After finding support from the rising 50-day MA and uptrend line, the Health Care SPDR ETF ($XLV) is poised to attack the prior swing high with a close above last week’s high. The recent pullback in $XLV was the shortest corrective wave over the past few months, coming in at less than 3.5% off the swing high. The pullbacks in August and June were about 5.5% and 8% respectively. Whenever the price swings tighten up within a base it is usually a good sign. We are placing $XLV on today’s watchlist. Trade details can be found above.

To make room for potential entries in $XLV and $HAO, we are selling $USO and $FXO on the open. Because $USO is range-bound after a false breakout, it may take several weeks of choppy action before it moves higher. Although $FXO could still looks okay, we are ditching our position for a very small loss, as we feel that setups in either $FXO or $HAO have more potential.
On the stock side, we raised several stops to reduce risk and lock in gains. Our stop in $BITA will now allow us to lock in a 30% gain at the very least, but it could easily run another 20% to 30% higher in the next few days.
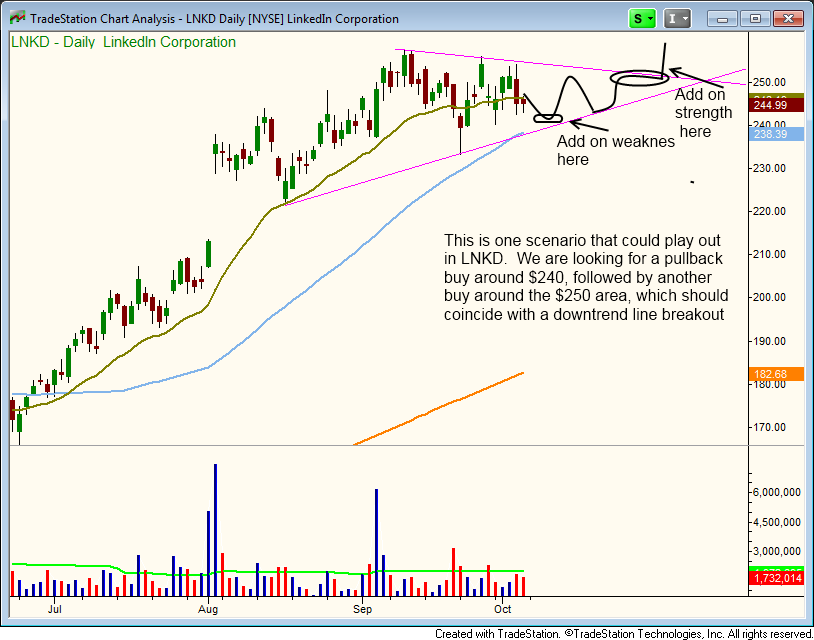
We still have one live order (a buy limit) in $LNKD, which we raised a bit to just over $240. The plan is to add another 33% to our existing 33% position on a slight pullback. We will then look for the price action to tighten up at or just below the downtrend line of the consolidation to add our final 33%. The ideal price action is drawn on the chart below.
