market timing model: BUY
Current signal generated on close of November 13.Portfolio exposure can be anywhere from 25% to 50% long. If positions are holding up well, then one can add exposure beyond 50%.Past signals:
- Neutral signal generated on close of November 6.
- Buy signal generated on close of September 9
- Neutral signal generated on close of August 15
- Buy signal generated on close of July 11
- Neutral signal generated on close of July 5
- Sell signal generated on close of June 24
today’s watchlist (potential trade entries):

Having trouble seeing the open positions graphic above? Click here to view it directly on your web browser instead.
open positions:
Below is an overview of all open positions, as well as a report on all positions that were closed only since the previous day’s newsletter. Changes to open positions since the previous report are listed in pink shaded cells below. Be sure to read the Wagner Daily subscriber guide for important, automatic rules on trade entries and exits.

Having trouble seeing the open positions graphic above? Click here to view it directly on your web browser instead.
closed positions:

Having trouble seeing the closed positions graphic above? Click here to view it directly on your web browser instead.
ETF position notes:
- $PALL buy limit order triggered and we are now long.
stock position notes:
- No trades were made.
ETF, stock, and broad market commentary:
After a few days of tight-ranged trading, stocks broke out to the upside on higher volume Wednesday.
The S&P 500 and Dow Jones rallied to new highs, while the NASDAQ Composite and Mid-cap S&P 400 set a new closing high for the year.
Last week’s ugly selling action in leadership stocks and broad market averages forced our timing model into neutral mode. The core of our model is below. It isn’t fancy, but it is effective. However, it does require some elbow grease (looking through lots of charts) and some discretion.
- Accumulation / distribution patterns in the S&P 500 and NASDAQ Composite
- The trend of all major averages (are they making higher highs and highs lows on the daily chart). Are major averages above the 10-week MA.
- The heaviest weighting is put on the price and volume action of leading stocks
No timing model is perfect. Although many traders are still on a quest to find the holy grail of trading systems, one simply does not exist. Once a trader accepts this and learns to deal in probabilities, then true progress can be made.
Yesterday’s price and volume action in the market was bullish. While a few leadership stocks were hit hard last week, we have seen enough bullish price action this week to suggest that the market may be able to push higher from here.
Because of this, we are placing our timing model back on a buy signal. This does not mean that the market will go higher from here, as the possibility for a false breakout in the major averages still exits. However, with most leadership stocks holding up well, we do not mind taking a few shots on the long side.
If new buy setups trigger and extend higher, then we will look to add more long exposure as setups develop. If our setups trigger and quickly fall apart, then we will be stopped out and back into cash.
After shaking all the longs out with a close below the 20-day EMA and downtrend line last Thursday, Financial Bull 3x ($FAS) has closed above the 20-day EMA the past four sessions.
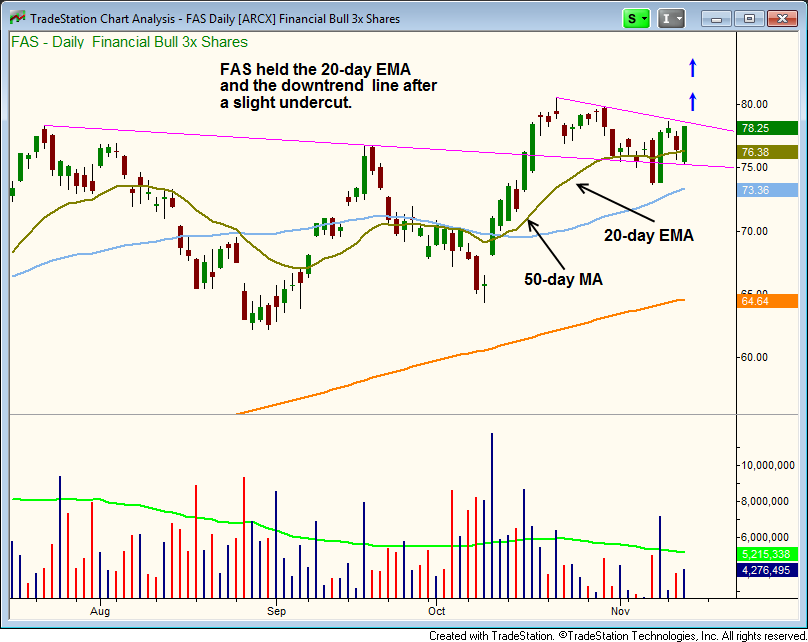
$FAS printed a bullish reversal candle yesterday, after opening slightly below Tuesday’s low and closing above Tuesday’s high on a pick up in volume. We look for the price action to break above the three-day high and move to new highs within the next few days. Trade details can be found in the watchlist section above.
After washing out longs with a close below 20-day EMA last Thursday (much like $FAS), Global X Funds ETF ($GURU) has recovered nicely, closing above the 20-day EMA four days in a row. Yesterday’s strong advance cleared the highs of the ugly selling candle on heavier than average volume.
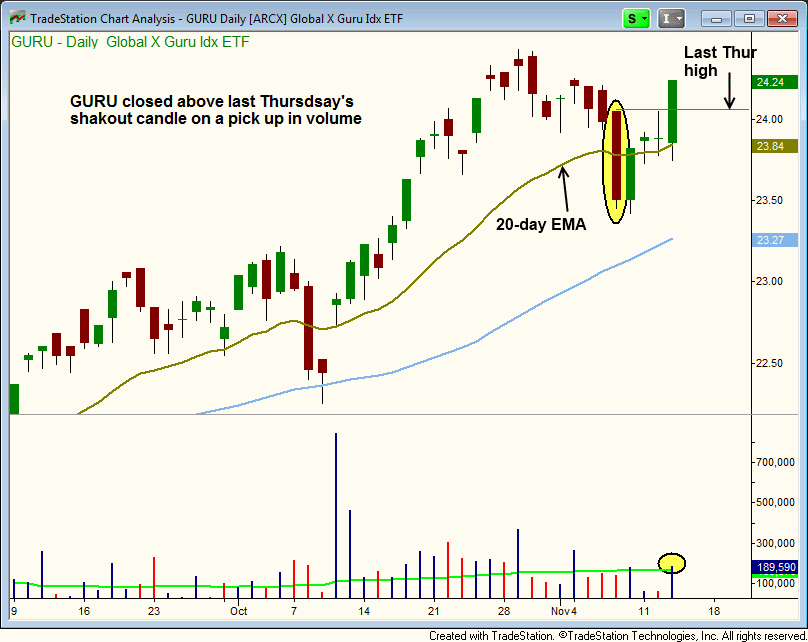
We are placing $GURU on today’s watchlist, along with a buy entry in the Direxion Daily Mid Cap Bull 3X ($MIDU), which is poised to breakout to new highs after Wednesday’s bullish candle. Trade details can be found above.
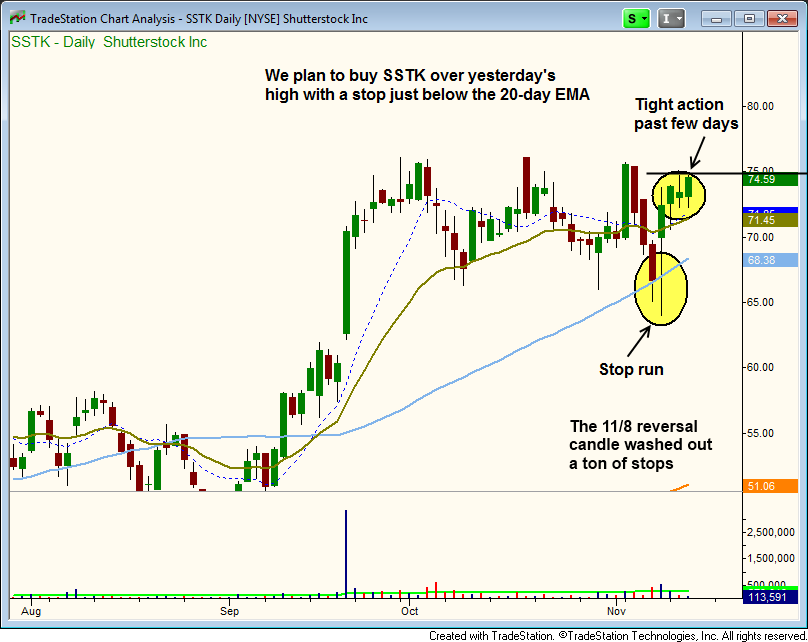
On the stock side, we have three new entries in $SSTK, $EVR, and $MCHP. Since $SSTK closed above the high of the big reversal candle on 11/8, we are waiving the 5-minute rule. The same goes for $MCHP, which has already closed above $43 the past two days.
We like the washout below the 50-day MA and big reversal candle that formed in $SSTK, which should breakout to new highs within the next few days.
Our entry in $MCHP is a pullback entry off the 10-day MA after a big volume gap up to new all-time highs. The stop is placed beneath the low of the gap up bar, which at this point should hold up.