market timing model: Buy
Current signal generated on close of September 9.Portfolio exposure can be anywhere from 50% to 100% long or more, meaning that conditions are strong enough to be on margin (if you are having plenty of success with your buys). You can not just go from 30% invested to 100% when you feel like it, you have to go from 30% to 60 or 75% and if those positions work, then you can add more.
Past signals:
- Neutral signal generated on close of August 15
- Buy signal generated on close of July 11
- Neutral signal generated on close of July 5
- Sell signal generated on close of June 24
today’s watchlist (potential trade entries):

Having trouble seeing the open positions graphic above? Click here to view it directly on your web browser instead.
open positions:
Below is an overview of all open positions, as well as a report on all positions that were closed only since the previous day’s newsletter. Changes to open positions since the previous report are listed in pink shaded cells below. Be sure to read the Wagner Daily subscriber guide for important, automatic rules on trade entries and exits. Click here to learn the best way to calculate your share size.

Having trouble seeing the open positions graphic above? Click here to view it directly on your web browser instead.
closed positions:
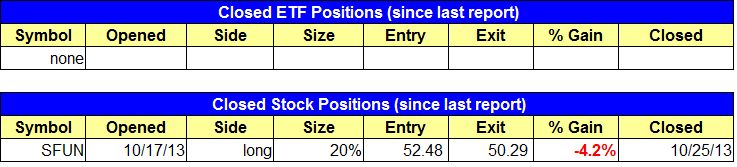
Having trouble seeing the closed positions graphic above? Click here to view it directly on your web browser instead.
ETF position notes:
- No trades were made.
stock position notes:
- Sold $SFUN as it triggered our stop for a smaller than average loss.
ETF, stock, and broad market commentary:
Stocks closed with modest gains across the board with the exception of the Russell 2000, which finished slightly negative on the day. Last week’s choppy price action has produced bull flag type patterns (so far) on the major averages. If the broad based averages remain above the 10-day MA, then the current rally could play out similar to the run up during the first quarter of this year, with very shallow corrections along the way.
Since May, iShares MSCI Frontier 100 ETF ($FM) has been tightening up on the weekly chart, with each selloff from swing high to low retracing less than the last. When we examine a stock or ETF’s basing action, we always look for a tightening of the price action and a dry up in volume. If a pattern has these two things going for it then it’s in pretty good shape. Note the dry up in volume during the past three weeks in $FM vs. the 10-week volume average.

After breaking out from a tight range above the 20-day EMA, the price action pulled back to the prior breakout level on declining volume last week. This is a key support level that should hold, especially with the rising 20-day EMA just below. We are placing $FM on today’s watchlist. Trade details can be found above.

Just a heads up, holdings in Kuwait 26%, Qatar 18%, United Arab Emirates 15%, and Nigeria 12%, account for more than 2/3 of $FM’s exposure.
On the stock side, we have one new buy setup in $LOCK, which is a potential pullback entry off the rising 50-day MA.

The chart below shows a 5-week flat base, which has only corrected about 13% off the highs. $LOCK has already found support on a touch of the 50-day MA a few weeks ago, and we look for the price action to find support at the 50-day MA once again. A second touch of the 50-day MA could potentially form a higher swing low within the base as well, which is a bullish sign.
