Buy– Signal generated on the close of December 31 (click here for more details)
today’s watchlist (potential trade entries):

Having trouble seeing the open positions graphic above? Click here to view it directly on your web browser instead.
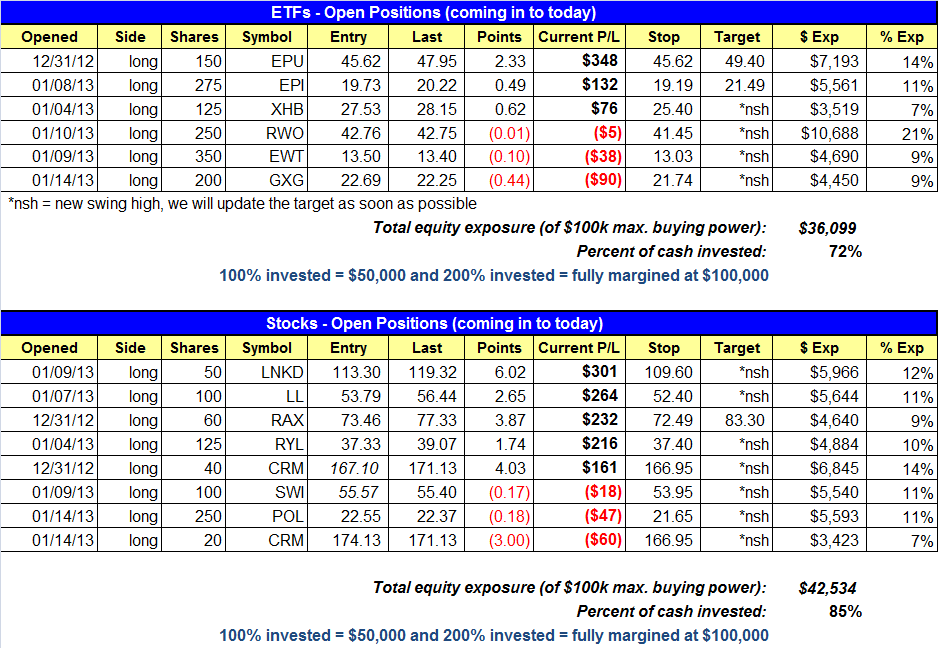
open positions:
Below is an overview of all open positions, as well as a report on all positions that were closed only since the previous day’s newsletter. Net P/L figures are based on two separate $50,000 model portfolios (one for ETFs and one for stocks). Changes to open positions since the previous report are listed in pink shaded cells below. Be sure to read the Wagner Daily subscriber guide for important, automatic rules on trade entries and exits.
Having trouble seeing the open positions graphic above? Click here to view it directly on your web browser instead.
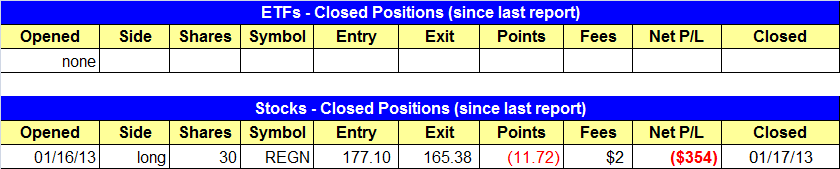
closed positions:
Having trouble seeing the closed positions graphic above? Click here to view it directly on your web browser instead.
ETF position notes:
- No trades were made.
stock position notes:
- Sold REGN as it gapped below our stop.
ETF, stock, and broad market commentary:
IMPORTANT CHANGE TO THE 5-MINUTE RULE
In order to keep our swing trading system simple and easy to manage, we have decided that the new 5-minute rule will apply to new trade entries only. This means that we will NOT be using the 5-minute rule on protective sell stops for existing open positions.
As for stocks and ETFs that gap down below the protective stop on the open, these positions will still immediately be sold on the open and without hesitation (just as we have been doing in the past). All stop prices listed will be firm. No exceptions.
Just to be clear, the 5-minute opening gap rule detailed in yesterday’s newsletter will still apply to new entries only. The final rules are posted below and will remain in our commentary through next Friday. In the meantime, we will amend the Wagner Daily Subscriber Guide to reflect the new changes with the opening gap rule for new positions.
How to handle stocks/ETFs that trade through our buy stop within the first 5-minutes of trading
- : No buy stops go live until 5 minutes after the stock market opens. So if the price action trades through our buy stop within the first 5-minutes of trading we do nothing and simply wait for 5-minutes. At 9:35 we mark the 5-minute high and add 10 cents to the 5-minute high as the new official entry point. As long as the 5-minute high is not more than 1.3% above the original trigger point the setup is still valid. If the 5-minute high (not adding the 10 cents) is more than 1.3% above our trigger, the trade is automatically canceled.
How to handle a morning gap up above our trigger: If the morning gap up is more than 1.3% above our entry the trade is automatically canceled. If the gap up is less than or equal to 1.3% we wait for 5-minutes to pass and then set a buy stop 10 cents above the 5-minute high, provided that the 5-minute high is not more than 1.3% above the original trigger.
Stocks put in a solid accumulation day across the board on Thursday, with broad market averages advancing 0.6% to 0.9% on higher volume. NYSE volume jumped 15% and Nasdaq volume increased by 4%. Institutions were clearly in buy mode which propelled all major averages to new short-term swing highs on the daily chart. The price and volume action of the past few weeks suggests that the market will continue to push higher.
$KBE hit our buy stop within the first 5-minutes of trading, so we held off on the entry. The price failed to break above the 5-minute high (plus 10 cents) the rest of the day, so a long position was not initiated. For those who were triggered on the open, continue to hold $KBE with the stop posted in today’s report. For those who did not enter, we have a new buy point listed in the watchlist section above.
The Market Vector Russia ETF ($RSX) is currently forming a tight ranged (cup and handle like) base on the weekly chart below. $RSX rallied about 30% off the lows before pulling back and successfully testing the downtrend line and forming the right side of the pattern.

The setup on the daily chart reveals a cup and handle with the cup portion forming the bottom and the handle on the right side of the pattern forming below the prior highs of September.

For a pattern to make our internal watchlist, it absolutely must stop making lower highs and lows and eventually break the downtrend line of the pullback. Once this happens and the price action forms a higher swing high and swing low, we then have something to work with. Without the higher lows or downtrend line break in place, all we have is a chart in a downtrend and showing no signs of momentum. We do not predict price action, so we never try to catch a bottom. The moving averages are confirming the recent strength in $RSX. Note the 20-day EMA has crossed above the 50-day MA, and the 50-day MA is now above the 200-day MA and trending higher. In late December, $RSX formed a second higher low, which led to a failed breakout above the prior swing high. The pullback from the failed breakout in early January looks to have found support at the rising 20-day EMA. If the pattern is to continue to tighten up and form higher swing lows, then the price action should hold the 20-day EMA. Our buy entry is over Thursday’s high with a stop below the 20-day EMA minus some wiggle room.
On the stock side we have one new buy setup to join $MDVN in $SODA. $SODA is forming a continuation breakout pattern, which is just a short-term correction after a stock breaks out. $SODA has a relative strength ranking of 90 with great earnings and revenue momentum quarter over quarter. Its industry group ranking is 34 out of 197, which is very strong. Earnings are due on 2/27, so the setup should have enough time to work out. Our buy entry is basically over the three day high with a stop below the 1/11 reversal candle (though the action shouldn’t dip back below Thursday’s low once it breaks out).

$LL came back to life on Thursday while $RYL closed above 39.00 on a pick up in volume. If $SWI can clear Thursday’s high we could see price action jump higher like $LL did yesterday. $REGN triggered our stop on a gap down and we are out.
If you are a new subscriber, please e-mail [email protected] with any questions regarding our trading strategy, money management, or how to make the most out of this report.
relative strength combo watchlist:
Our Relative Strength Combo Watchlist makes it easy for subscribers to import data into their own scanning software, such as Tradestation, Interactive Brokers, and TC2000. This list is comprised of the strongest stocks (technically and fundamentally) in the market over the past six to 12 months. The scan is updated every Sunday, and this week’s RS Combo Watchlist can be downloaded by logging in to the Members Area of our web site.