market timing model: BUY
Current signal generated on close of November 13.
Portfolio exposure can be anywhere from 50 to 100% long. If positions are holding up well, then one can add exposure beyond 100%.
Past signals:
- Neutral signal generated on close of November 6.
- Buy signal generated on close of September 9
- Neutral signal generated on close of August 15
- Buy signal generated on close of July 11
- Neutral signal generated on close of July 5
- Sell signal generated on close of June 24
today’s watchlist (potential trade entries):

Having trouble seeing the open positions graphic above? Click here to view it directly on your web browser instead.
open positions:
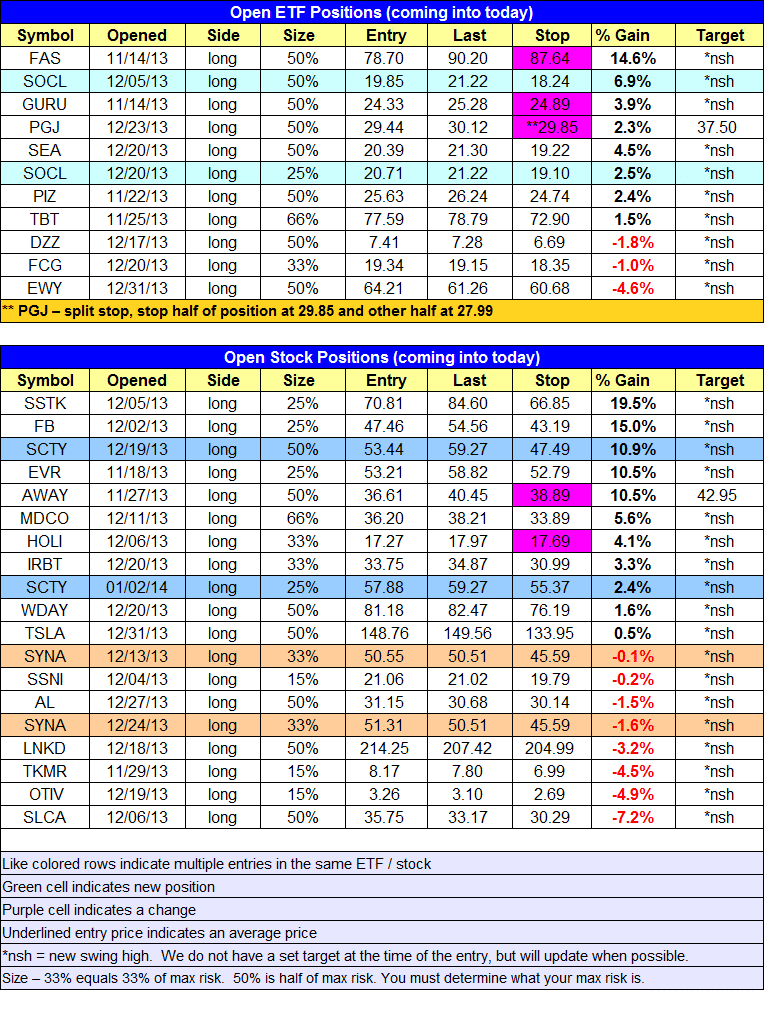
Below is an overview of all open positions, as well as a report on all positions that were closed only since the previous day’s newsletter. Changes to open positions since the previous report are listed in pink shaded cells below. Be sure to read the Wagner Daily subscriber guide for important, automatic rules on trade entries and exits.
Having trouble seeing the open positions graphic above? Click here to view it directly on your web browser instead.
closed positions:

Having trouble seeing the closed positions graphic above? Click here to view it directly on your web browser instead.
ETF position notes:
- Note the new stop prices above.
stock position notes:
- Note the new stop prices above.
ETF, stock, and broad market commentary:
Thursday’s weakness spilled over to Friday in large cap stocks, with the NASDAQ 100 losing -0.7% and closing at the lows of the day. The S&P 500 did not break Thursday’s low, but closed off the highs of the session. Small and mid-cap stocks held up best, with both the Russell 2000 and S&P 400 up 0.4%.
The market remains vulnerable to more short-term selling, especially if the 10-day MA does not hold on the daily chart of the main averages. But overall, market conditions remain strong and our timing model is still in buy mode.
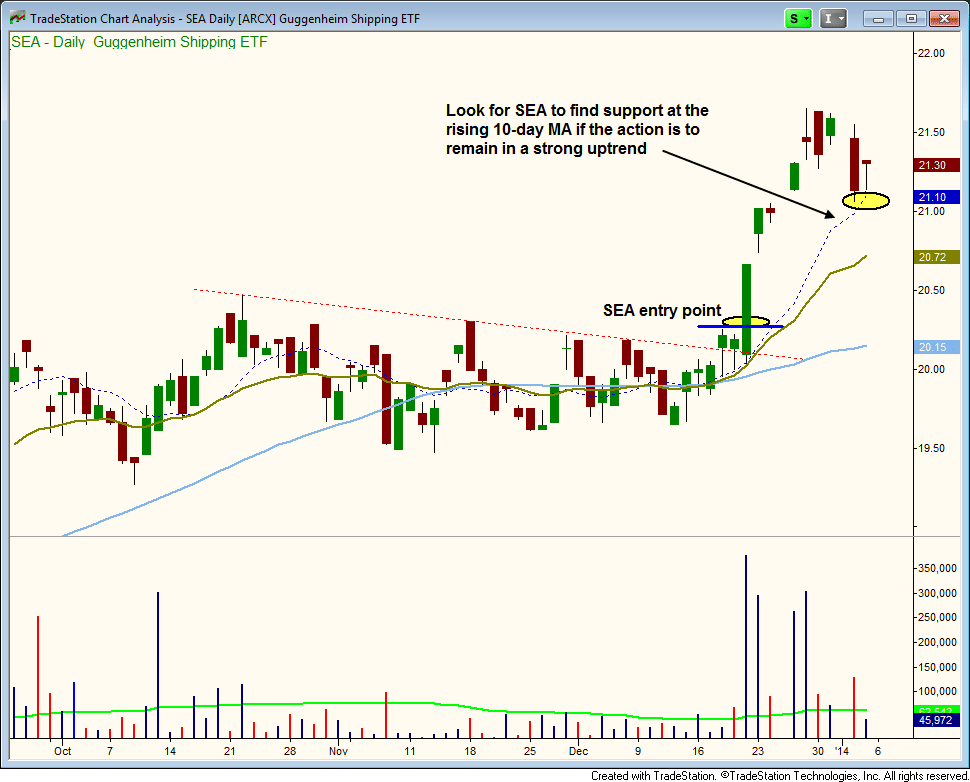
Guggenheim Shipping ETF ($SEA) is in pullback mode after a big volume, base breakout two weeks ago. The first touch of a rising 10-day MA is often a decent buy point when the initial breakout entry is missed. The 10-day MA should provide support if the strong uptrend is to remain intact. We are still long from our breakout entry above the two-day high on 12/20.
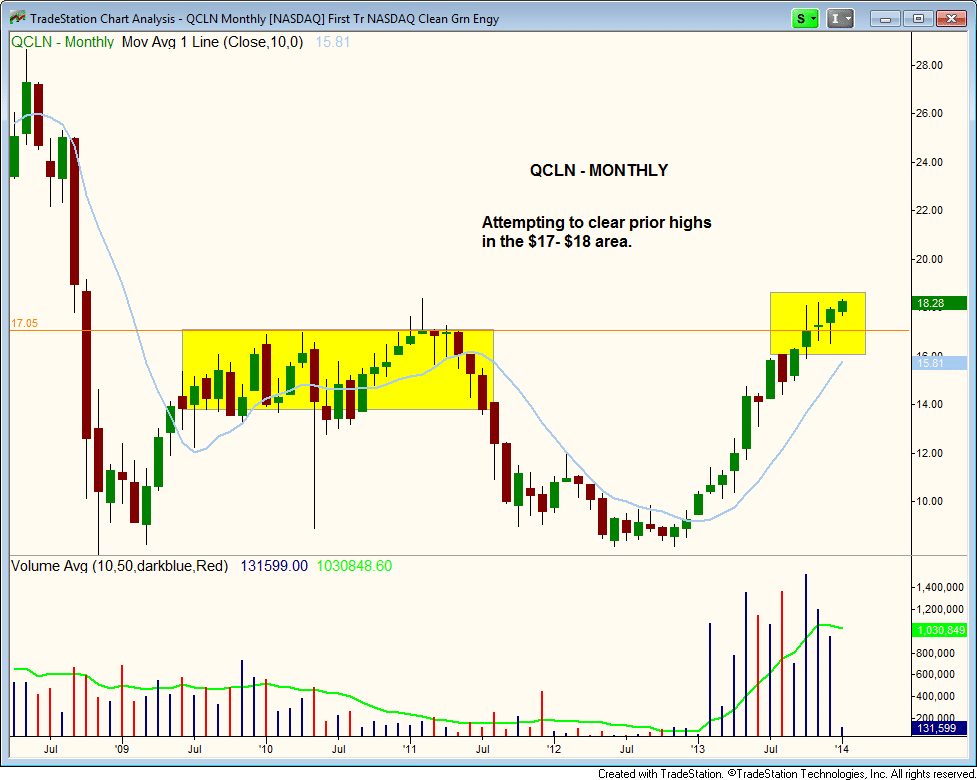
First Trust NASDAQ Clean Edge ETF ($QCLN) is attempting to breakout above prior highs on the monthly chart. The volume was quite impressive during the rally in 2013, so the price action should eventually follow through to the upside.
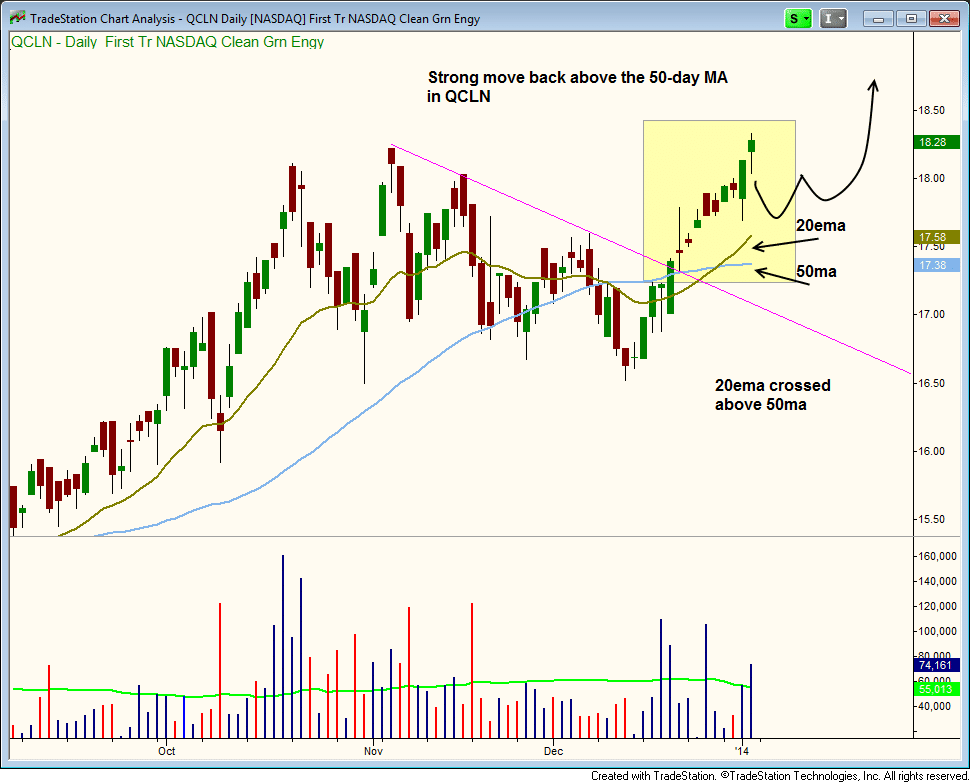
Dropping down to the daily chart, wee see that $QCLN is back above the 50-day MA and is testing the highs of the current range. Ideally, we would like to see the price action back off the highs and chop around for a week or two above the 20-day EMA (form a tight handle). Also, the 20-day EMA is now back above the 50-day MA, which has remained in an uptrend through the correction.
We raised the stop in $FAS to protect gains. We also raised the stop in GURU and $PGJ. Note the split stop in $PGJ.
On the stock side we have one new buy entry in Tower International ($TOWR), which has been consolidating in a tight range since August. The 40-week MA has basically caught up to the price action after a lengthy base, so we could potentially see an explosive breakout above $22
TOWR is not an A rated setup so the share size is reduced.
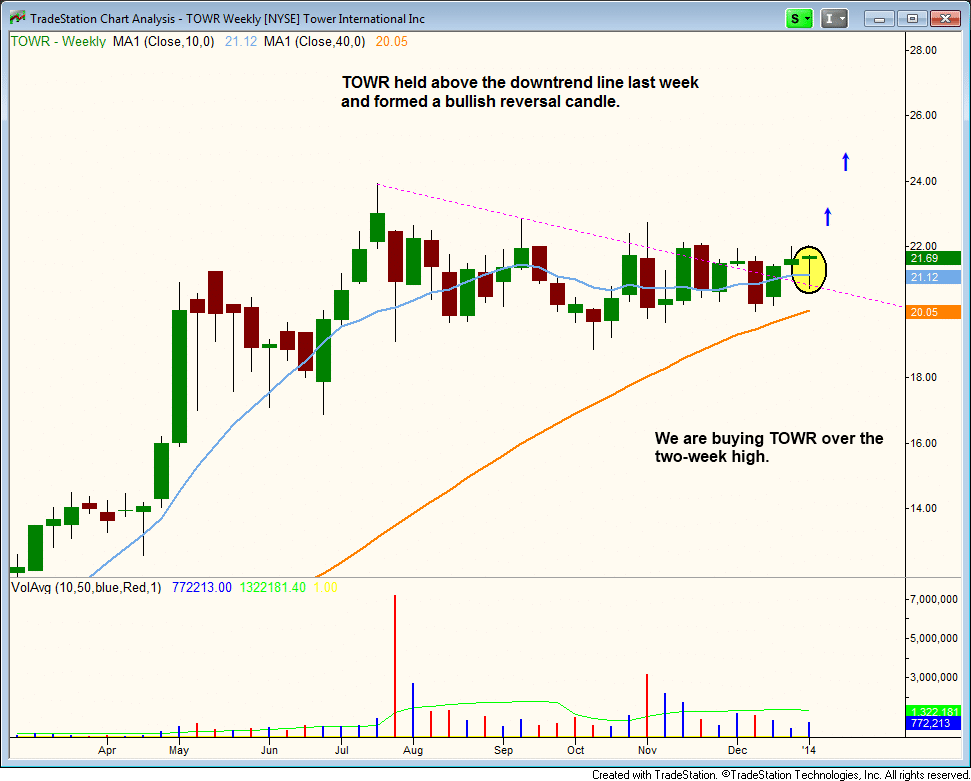
A breakout above the current range high would also produce an all-time high, which is an ideal situation (a multiple time frame entry).
Note that we have a tight stop in $HOLI due to last week’s selling. We also have a tight stop in $AWAY, in case the action fails to hold above the 20-day EMA.