Confirmed Buy– Signal generated on the close of January 22 (click here for more details)
today’s watchlist (potential trade entries):

Having trouble seeing the open positions graphic above? Click here to view it directly on your web browser instead.
open positions:
Below is an overview of all open positions, as well as a report on all positions that were closed only since the previous day’s newsletter. Net P/L figures are based on two separate $50,000 model portfolios (one for ETFs and one for stocks). Changes to open positions since the previous report are listed in pink shaded cells below. Be sure to read the Wagner Daily subscriber guide for important, automatic rules on trade entries and exits.
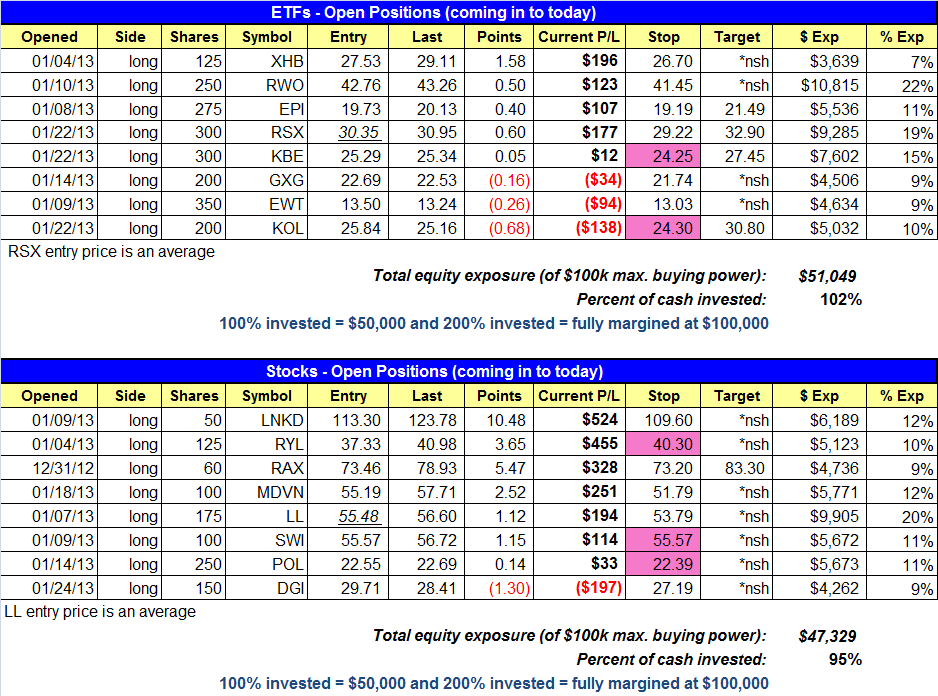
Having trouble seeing the open positions graphic above? Click here to view it directly on your web browser instead.
closed positions:

Having trouble seeing the closed positions graphic above? Click here to view it directly on your web browser instead.
ETF position notes:
- No trades were made.
stock position notes:
- No trades were made.
ETF, stock, and broad market commentary:
In what was a positive response to last Thursday’s distribution in the Nasdaq and churning in the NYSE, stocks closed higher across the board with the major averages gaining 0.5% on average. The market continues to climb higher despite $AAPL breaking down and very overbought readings on short-term oscillators.
$RWO finally got going last week along with $RSX, which broke out on Friday by clearing the high of the handle at 30.73. $EWT needs to hold on to the swing low of December 21 to continue producing higher swing lows along the base. $KOL failed to hold above the low of January 16, so we could see a test of the 50-day moving average within the next few days. We definitely do not want to see the price action fail at the 50-day MA.
We have one new official setup added to today’s watchlist in $EWS – iShares MSCI Singapore Index Fund. The weekly chart below shows the tight price action over the past six weeks above 13.50.

The tight consolidation should eventually lead to a breakout and test of the prior highs of 2011, around 14.50.
Dropping down to the daily chart, we see the price action tightening up between converging trendlines. Note that the moving averages are in order and trending higher. The 20-day EMA is greater than the 50-day MA, and the 50-day is greater than the 200-day MA.

Volume has tapered off the past two weeks, as the 10-day moving average of volume is at its lowest level since March of 2012. It is a bullish sign when volume drops after several weeks of consolidation, especially when a pattern is close to completing and setting up to break out. The buy entry in $EWS is above the two-day high, which should lead to a break of the dotted downtrend line. The stop is placed beneath the lows of the base. We might be able to add to the position if $EWS breaks out but stalls around the 13.90 to 14.00 area for a few days.
On the stocks side, $LNKD and $RYL continue to build momentum. On $RYL, we are going with a very tight stop to lock as much of the move up as possible ahead of earnings on Jan. 29. $POL reports earnings on Jan. 29 as well, so we raised the stop to near break-even to avoid taking a loss. If $POL does not stop out, then we will definitely exit by the close of 1/29, as we do not want to hold through earnings without a decent profit buffer. We raised the stop in $SWI (to break-even) as well ahead of earnings on Feb. 4. $DGI’s action last Friday was disappointing, but the reversal candle low must be broken to trigger our stop.
We have one new setup added to the official watchlist in $CTRX – Catamaran Corp. $CTRX has a solid relative strength ranking of 87 with strong earnings and revenue momentum. $CTRX has tightened up quite a bit on the daily chart since November. The 20-day EMA crossed above the 50-day MA and should now provide support on any pullback.

Last Thursday, $CTRX failed a breakout attempt above 53.16, but still managed to close near the highs of the handle on Thursday and again on Friday. We like $CTRX as a breakout entry above Thursday’s high. The stop is placed below the bullish reversal candle low of Jan. 11, which is also below the rising 20-day EMA. The stop is about 6% away, which is well within our limit. For example, if the stop had been 12-15% away, this would have indicated that the price action was still a bit too wide for a low-risk entry. We prefer stops to be around the 4-6% area, but we will go up to 10% on more on volatile names.
To all new subscribers, if you can, please attend our webinar every Monday and Wednesday at 12 pm to get the most out of our service. It is here where you will learn the most about our style of swing trading. For those who are unable to attend the webinar, you can log in to the members section to access a recording after 5pm on the day of the webinar.
If you are a new subscriber, please e-mail [email protected] with any questions regarding our trading strategy, money management, or how to make the most out of this report.
relative strength combo watchlist:
Our Relative Strength Combo Watchlist makes it easy for subscribers to import data into their own scanning software, such as Tradestation, Interactive Brokers, and TC2000. This list is comprised of the strongest stocks (technically and fundamentally) in the market over the past six to 12 months. The scan is updated every Sunday, and this week’s RS Combo Watchlist can be downloaded by logging in to the Members Area of our web site.