Buy– Signal generated on the close of December 31 (click here for more details)
today’s watchlist (potential trade entries):

Having trouble seeing the open positions graphic above? Click here to view it directly on your web browser instead.
open positions:
Below is an overview of all open positions, as well as a report on all positions that were closed only since the previous day’s newsletter. Net P/L figures are based on two separate $50,000 model portfolios (one for ETFs and one for stocks). Changes to open positions since the previous report are listed in pink shaded cells below. Be sure to read the Wagner Daily subscriber guide for important, automatic rules on trade entries and exits.
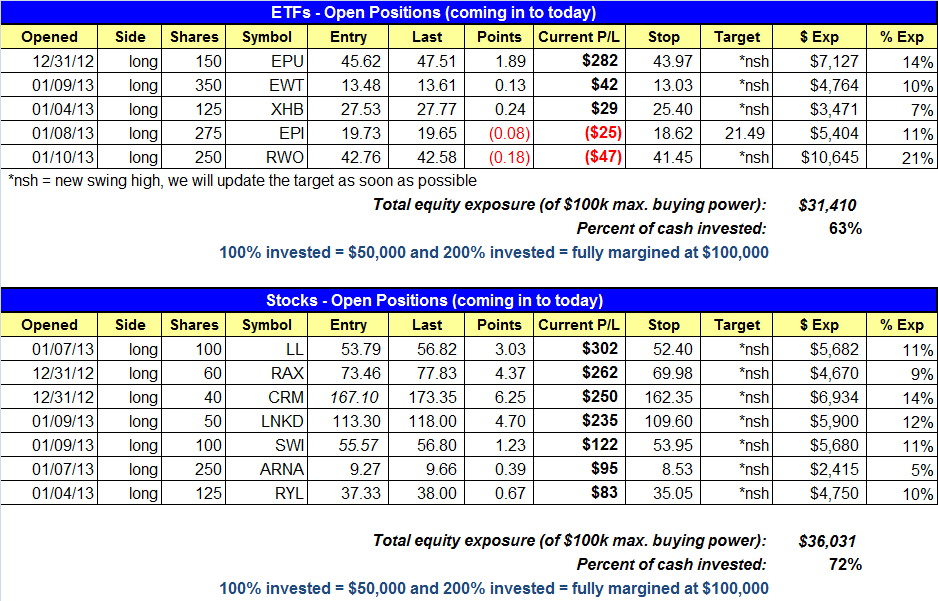
Having trouble seeing the open positions graphic above? Click here to view it directly on your web browser instead.
closed positions:

Having trouble seeing the closed positions graphic above? Click here to view it directly on your web browser instead.
ETF position notes:
- No trades were made.
stock position notes:
- Note the change in stop price to $POL setup.
ETF, stock, and broad market commentary:
After fighting off some early morning weakness, stocks firmed up by 11:30 am and pushed higher the rest of the day, with most broad market averages closing near the highs of the session. The small and mid-cap averages were slightly weaker once again, closing near the mid-point of the day’s range. Most averages formed a tight-ranged inside day, with all (or most) of Friday’s trading taking place within Thursday’s range. The market was quite resilient last week in fighting off a few potential distribution days and that is a bullish sign.
Total volume sank by 17% on the NYSE but increased by 1% on the Nasdaq. There isn’t much to write about with regard to volume on Friday. We avoided distribution, and as long as that continues the market should be in good shape.
We have two new buy setups on the watchlist for Monday. We are looking to add to an existing position in $EWT on a range breakout. The second setup is in $GXG:
For the past few weeks, we have been monitoring the action in the Global X InterBolsa FTSE Colombia20 ($GXG) for a decent buy entry. Before we dive into the daily chart and our buy setup, let’s revisit the monthly chart which we posted a few weeks ago:

Note the tight consolidation that has formed since May 2012. A breakout above 22.70 that holds should lead to a move to the $24.00 area.
Dropping down to the daily chart, last Friday’s reversal candle off the 20-day EMA is a buy signal IF the price action can clear the high of Friday’s candle on Monday.

A break down below the 20-day EMA would negate the setup in the short term and probably result in a test of the 50-day MA.
SPDR Dow Jones Global Real Estate ($RWO) remains in good shape after triggering a buy entry for us last week. We always prefer to see chart patterns tighten up right before they breakout above the range highs, and $RWO has tightened up nicely over the past two weeks while holding above the 20-day EMA:

On the stock side, we plan to add to our position in CRM with a breakout above the two-day high. We like the tight, three week consolidation at the highs:

The $POL buy setup from Friday remains intact with a slightly lower stop in place. For those interested, $HLSS is a potential UNOFFICIAL buy setup above the 4-day high with a tight stop (5% or so from entry). Please note that $HLSS reports earnings later this week, and if you decide to hold through earnings make sure you are comfortable with your size. For those who do not own $RYL with us, $KBH is a potential UNOFFICIAL buy entry over 16.94 with a stop at 15.85.
If you are a new subscriber, please e-mail [email protected] with any questions regarding our trading strategy, money management, or how to make the most out of this report.
relative strength combo watchlist:
Our Relative Strength Combo Watchlist makes it easy for subscribers to import data into their own scanning software, such as Tradestation, Interactive Brokers, and TC2000. This list is comprised of the strongest stocks (technically and fundamentally) in the market over the past six to 12 months. The scan is updated every Sunday, and this week’s RS Combo Watchlist can be downloaded by logging in to the Members Area of our web site.