Commentary:
October began with a modest morning gap up, that was immediately met by a strong wave of selling. Ultimately, all of the major indices closed up on the day, but there was both time and price divergence among them. By 10:30 am both the Dow Jones Industrial Average and S&P 500 found their footing, and managed to rally the remainder of the day. On the other hand, the Small-Cap Russell 2000, S&P MidCap 400 and the Nasdaq Composite, were unable to establish a bottom until the 11:30 reversal period. Despite the delayed price reversal, the Russell 2000 managed the biggest gain on the day by finishing up 0.5%. The Dow Jones Industrials and the S&P 500 were not far behind, as each posted 0.4% gains on Friday. Finally, the MidCap S&P 400 and the Nasdaq were the laggards on the day. The MidCap 400 realized a paltry 0.2% rise and the Nasdaq almost closed the day flat, as it managed a 0.1% increase. Overall, the markets lacked conviction and as a result, gains were modest.
Trading volume was significantly down on Friday. Day over day, NYSE volume dropped about 8.0%, while Nasdaq volume plunged 20%. The low volume rally kept the DJIA, S&P 500 and Nasdaq contained within the tight, 5 day trading range. Despite the lack of turnover, advancing volume outpaced declining volume by a ratio of 4.6 to 1 on the NYSE, while the ratio on the Nasdaq was slightly positive at 1.1 to 1. Friday’s internals suggest a lack of any significant participation by large institutions. But, the recent “price consolidation” suggests a continuation of the current uptrend.
Market Vectors Brazil Small Cap (BRF) provides an excellent example of tight consolidation preceding a “breakout” to new highs. From September 13th through September 30th this ETF traded within a $1.75 range. Consolidation is quite important in the life cycle of a trend. As markets rally, consolidation serves as a “breather”, from which a base is built to fuel the new highs. Notice the impressive increase in volume in BRF on September 10th and September 11th, Another volume “spike” occurred on September 29 and 30. On Friday, as overall market volume decreased, the volume in BRF increased by 5%. Even though the volume on the day was not spectacular, the stage was set for the breakout based on the preceding two weeks volume and price action. BRF closed near the highs of the day, further supporting a sustainable rally. Potential purchase points for BRF would be a pullback into the area of consolidation or a breakout above the current level after several days of consolidation.

The PowerShares DB Agricultural Fund (DBA) may be in the midst of a trend reversal. On Thursday, DBA breached the 20-day EMA, but then managed to bounce back and close near the highs of the session. But, on Friday, the explosion in volume precipitated a major selloff in DBA, and it closed near the lows of the day. This massive volume spike and resulting price action, suggests that more than just a pull back may be at hand. Friday’s price move was the largest intraday dollar change since the rally began in early June. On the daily chart, DBA shattered the 20-day EMA, but did manage to find support near the 50-day Moving Average. The 50-day MA also coincides with the uptrend line drawn through the June 7th, June 29th and July 7th lows. A light volume rally back into the 20-day EMA could provide a good shorting opportunity. A more conservative approach would be to wait for DBA to set a lower high and a lower low. But, due to Friday’s massive explosion in volume, a rally on light volume back into the 20-day EMA, likely provides a lower risk entry than is typical for this setup.


Today’s Watchlist:
There are no new official setups for today. As awlays, we will promptly send an intraday alert if anything catches our eye while trading.
Daily Performance Report:
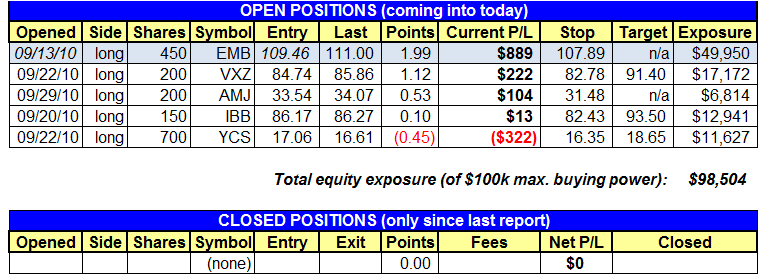
Below is an overview of all open positions, as well as a performance report on all positions that were closed only since the previous day’s newsletter. Net P/L figures are based on the $50,000 Wagner Daily model account size. Changes to open positions since the previous report are listed in red text below. Please review the Wagner Daily Subscriber Guide for important, automatic rules on trigger and stop prices
- The row shaded in light blue indicates a dividend is included in unrealized p/l points (for EMB).
- Reminder to subscribers – Intraday Trade Alerts to your e-mail and/or mobile phone are normally only sent to indicate a CHANGE to the pre-market plan that is detailed in each morning’s Wagner Daily. We sometimes send a courtesy alert just to confirm action that was already detailed in the pre-market newsletter, but this is not always the case. If no alert is received to the contrary, one should always assume we’re honoring all stops and trigger prices listed in each morning’s Wagner Daily. But whenever CHANGES to the pre-market stops or trigger prices are necessary, alerts are sent on an AS-NEEDED basis. Just a reminder of the purpose of Intraday Trade Alerts.
- For those of you whose ISPs occasionally deliver your e-mail with a delay, make sure you’re signed up to receive our free text message alerts sent to your mobile phone. This provides a great way to have redundancy on all Intraday Trade Alerts. Send your request to [email protected] if not already set up for this value-added feature we provide to subscribers.

Having trouble seeing the position summary graphic above?
Click here to view it directly on your Internet browser instead.
Notes:
Edited by Deron Wagner,
MTG Founder and
Head Trader