Current signal generated on close of July 5
Past signals:
- Sell signal generated on close of June 24
- Neutral signal on the close of June 20
today’s watchlist (potential trade entries):

Having trouble seeing the open positions graphic above? Click here to view it directly on your web browser instead.
open positions:
Below is an overview of all open positions, as well as a report on all positions that were closed only since the previous day’s newsletter. Net P/L figures are based a $100,000 model portfolio. Changes to open positions since the previous report are listed in pink shaded cells below. Be sure to read the Wagner Daily subscriber guide for important, automatic rules on trade entries and exits.

Having trouble seeing the open positions graphic above? Click here to view it directly on your web browser instead.
closed positions:

Having trouble seeing the closed positions graphic above? Click here to view it directly on your web browser instead.
ETF position notes:
- $FDN buy entry triggered.
stock position notes:
- $SLCA and $TUMI buy entries triggered.
ETF, stock, and broad market commentary:
Stocks gapped higher on the open, but failed to follow through and basically chopped around all session long. Most averages closed up on the day, about 0.4% to 0.6% higher, with the NASDAQ 100 and Midcap S&P 400 noticeable laggards. The NASDAQ 100 was held down by the selling in semiconductors, sending the Market Vectors Semiconductor ETF ($SMH) back below the 50-day MA, down 2.1%. While $SMH does not have to lead the market higher, it would not be a good sign if support doesn’t kick in at around the 50-day MA during the next two weeks.
Turnover picked up across the board, and while it is a positive to see some accumulation, the market has yet to put in a strong follow through type day to confirm that a potential, intermediate-term bottom is in place. For those who are new to our service, a follow through day occurs when either the S&P 500 or NADSAQ rallies at least 1.5% on higher volume.
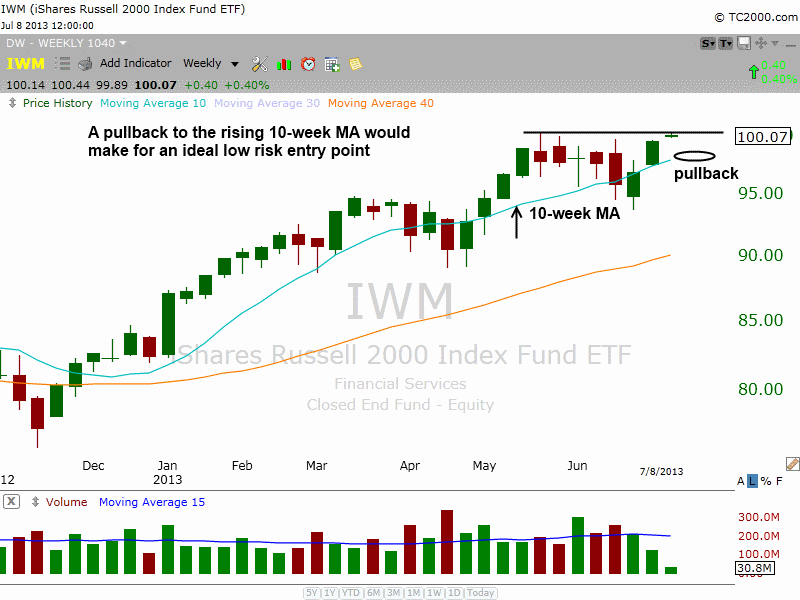
As mentioned in yesterday’s report, the relative strength in the small-cap Russell 2000 ETF ($IWM) is impressive, as it has already established a new closing high for the year, while the S&P 500 and NASDAQ Composite struggle to reclaim the 50-day MA. A short-term pullback to or near the rising 10-week MA would present us with a low risk entry point, around the $98.50 – $99 level.

Although we are in neutral mode, market conditions are improving, and as long as the major averages can hold at or near the 50-day MA, then we should eventually see a decent rally emerge.
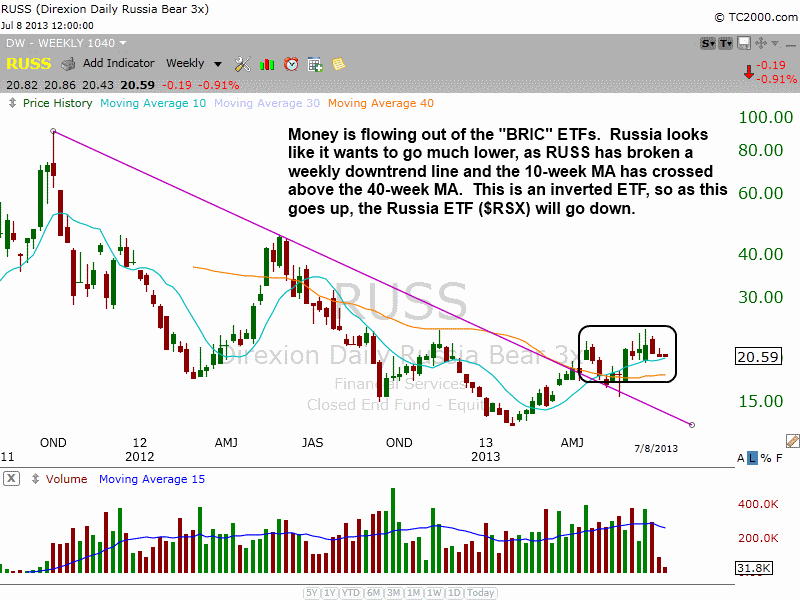
Money continues to flow out of foreign markets and in to the U.S. as of late. Asian ETFs have been under distribution the past few months, while the charts of “BRIC” countries (Brazil, Russia, India, and China) are breaking down and in danger of rolling over. $EWZ (Brazil) has already taken the plunge, with a nasty selloff the past six weeks. The Russia ETF ($RSX) is in bad shape and could potential roll over soon. Looking at the weekly chart of the inverted Direxion Daily Russia Bear 3X ($RUSS), we see a clear downtrend line breakout, followed by the 10-week ma crossing above the 40-week MA, signaling a change in trend. The price action has tightened up the past few weeks as well. $RUSS is an inverted ETF, meaning that it will go higher if $RSX sells off. Further weakness in Russia could lead to a move to the $40 level in $RUSS.

We added one new ETF to the portfolio yesterday, as $FDN triggered a buy entry on the open. We also added two new stock positions in $SLCA and $TUMI. $TUMI followed through on the entry with a 3% gain on a pick up in volume.
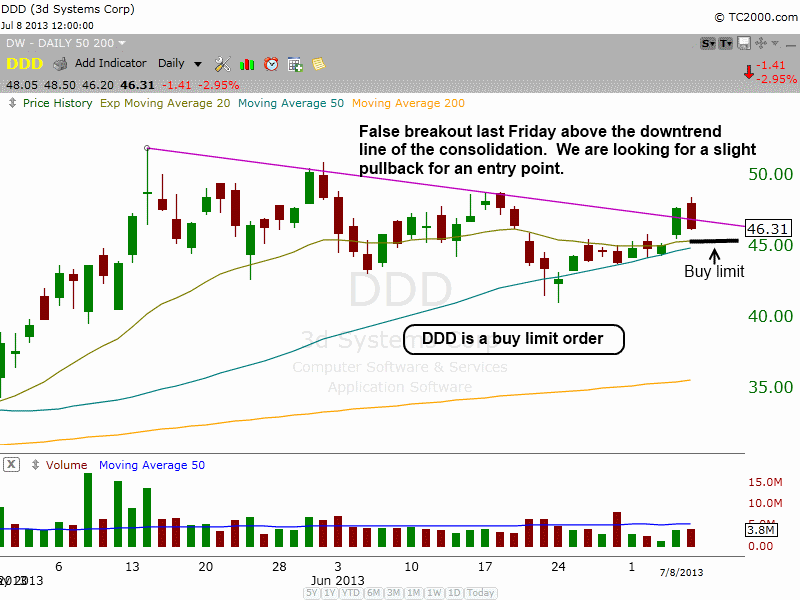
We have one new setup on today’s watchlist in 3d Systems ($DDD). $DDD has a relative strength ranking of 95 and an EPS ranking of 96, so it is both technically and fundamentally strong. The daily chart below shows the bullish consolidation above the 50-day MA since topping out at $50 in May. $DDD probed above the downtrend line last Friday, but closed back below the line yesterday. We are looking for a short-term pullback to $46 as a buy entry. This is a buy limit order, so we are buying on weakness, not strength. $DDD must touch our entry for the setup to trigger. We are keeping our size small in case we have to hold $DDD through earnings (on July 25). If we are negative in the trade heading in to earnings, then we will probably cut our share size down to remove some of the risk. Please note that since $DDD is a buy limit order the 5-minute rule will not apply.
