- Buy signal generated on close of September 9
- Neutral signal generated on close of August 15
- Buy signal generated on close of July 11
- Neutral signal generated on close of July 5
- Sell signal generated on close of June 24
today’s watchlist (potential trade entries):

Having trouble seeing the open positions graphic above? Click here to view it directly on your web browser instead.
open positions:
Below is an overview of all open positions, as well as a report on all positions that were closed only since the previous day’s newsletter. Changes to open positions since the previous report are listed in pink shaded cells below. Be sure to read the Wagner Daily subscriber guide for important, automatic rules on trade entries and exits.

Having trouble seeing the open positions graphic above? Click here to view it directly on your web browser instead.
closed positions:
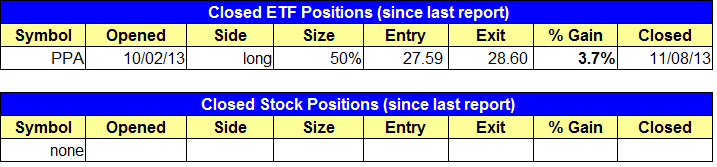
Having trouble seeing the closed positions graphic above? Click here to view it directly on your web browser instead.
ETF position notes:
- $PPA triggered our stop on the open and we are out with a 4% gain.
stock position notes:
- No trades were made.
ETF, stock, and broad market commentary:
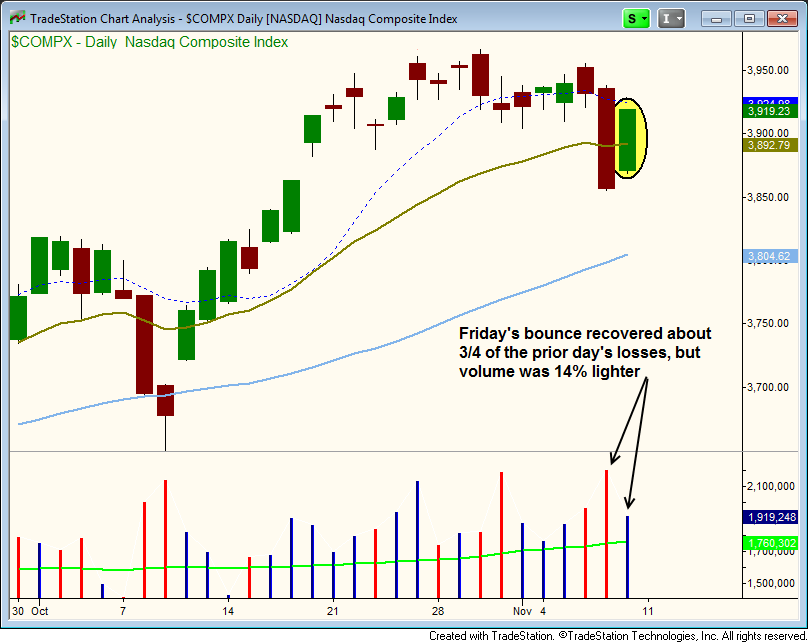
Stocks staged a strong comeback on Friday, with all major averages gaining at least 1.0% and reclaiming about 75% of Thursday’s losses. The only negative on the session was the lighter turnover in both exchanges (NYSE and NASDAQ).
The NASDAQ Composite is now back above the 20-day EMA, but still must get through resistance at the 3,920 – 3,950 area.
As mentioned last week, due to the bearish distribution count in the NASDAQ and more importantly the relative weakness in many leadership stocks, our timing model shifted from buy to neutral mode. In neutral, we still have the freedom to buy stocks if/when setups develop, but typically our long exposure will not go over 30-40% until there is a buy signal in place.
If leading stocks are able to find some traction this week and no more damage is done, then we could be back into the market and testing the water within long positions in a week or two.
On the ETF side, we are stalking a potential short entry in the YEN by going long the ProShares UltraShort YEN ETF ($YCS).
After several months of consolidation, the price action in $YCS has tightened up considerably, which is bullish. Notice how the distance from each swing high to swing low has tightened up since June and July.
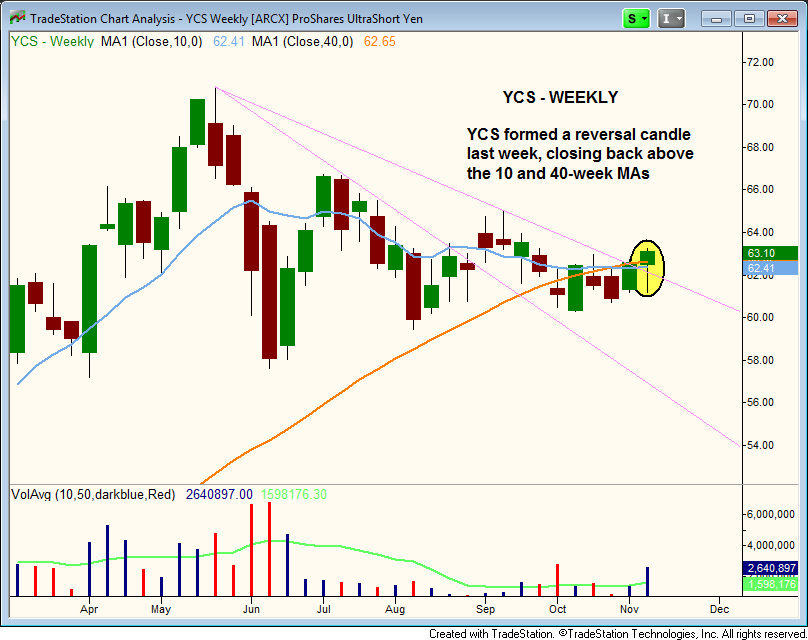
Thursday’s wild price action on the daily chart looks to have been a shakeout, as Friday’s action closed near the highs of the week. The reversal candle on higher volume also closed above the 10-week and 40-week MAs. chart.
We are placing $YCS on today’s watchlist. Trade details can be found above.
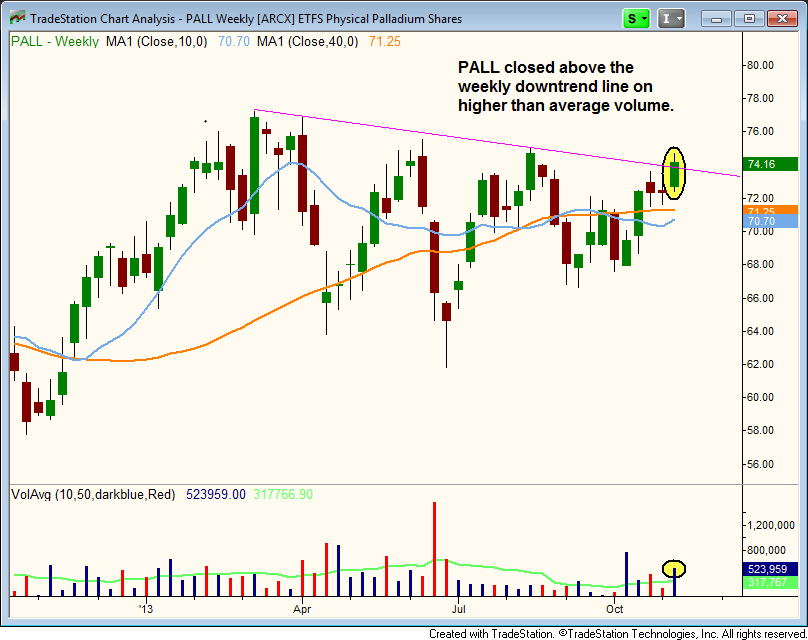
ETFS Physical Palladium Shares ($PALL) remains an official buy setup on today’s watchlist. Last week’s close broke the weekly downtrend line on higher volume. We also see the 10-week MA (in blue) beginning to turn up.
We look for $PALL to either clear last week’s high and test the highs of 2013, or potential chop around for a few weeks in a tight range before breaking out.
On the stock side, $KORS and $MDCO remain in decent shape. $URI had an ugly candle last Thursday, but is still alive as well. We will continue to monitor the action in these names over the next few days for potential re-entry points if the market is able to run higher.
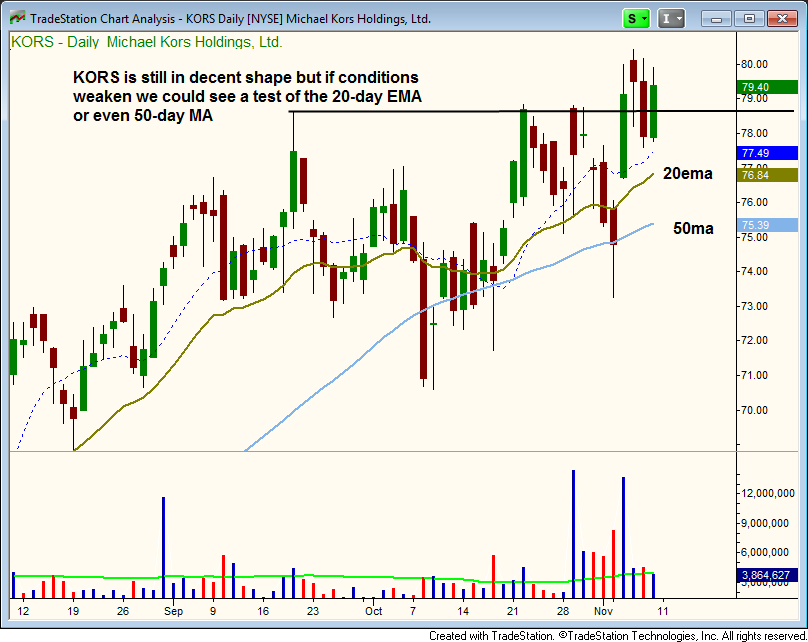
Even if the market sells off from here, there is a good chance $KORS may simply form a base on base pattern. This is where the price action after a breakout basically sits around in a tight range and goes nowhere for a few weeks. These patterns usually form when the major averages are in correction mode.
$GOGO reports earnings before the open tomorrow. This is a recent IPO trading in a tight range near the highs. Note the big volume accumulation on the move off the lows of August.
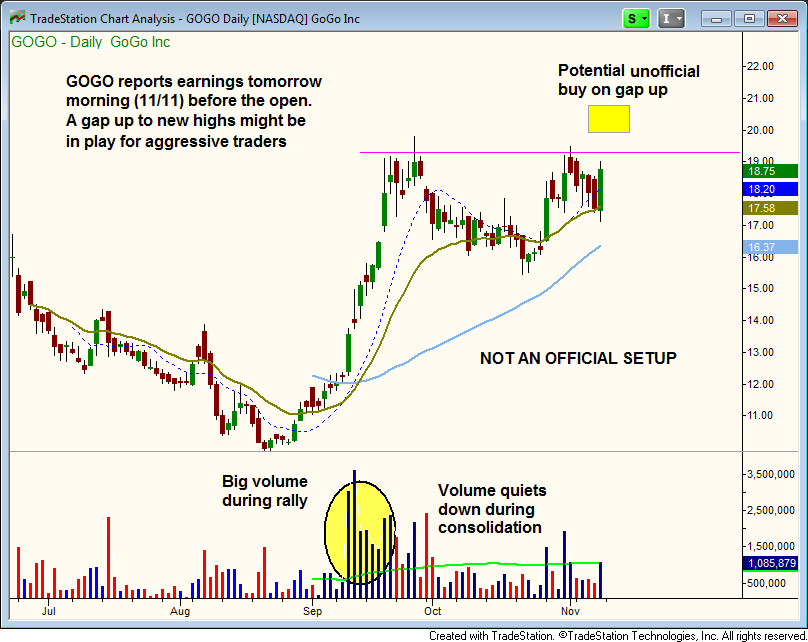
If $GOGO gaps to new highs on big volume, then it could be in play for a day trade or short-term pop on the open. This is an unofficial setup for aggressive and experienced traders only.