market timing model: Neutral
Current signal generated on close of November 6.Portfolio exposure can be anywhere from 0% to 25% long depending on how individual setups are holding up. Now is not the time to press the long side. Honor stops.
Past signals:
- Buy signal generated on close of September 9
- Neutral signal generated on close of August 15
- Buy signal generated on close of July 11
- Neutral signal generated on close of July 5
- Sell signal generated on close of June 24
today’s watchlist (potential trade entries):

Having trouble seeing the open positions graphic above? Click here to view it directly on your web browser instead.
Below is an overview of all open positions, as well as a report on all positions that were closed only since the previous day’s newsletter. Changes to open positions since the previous report are listed in pink shaded cells below. Be sure to read the Wagner Daily subscriber guide for important, automatic rules on trade entries and exits.

Having trouble seeing the open positions graphic above? Click here to view it directly on your web browser instead.
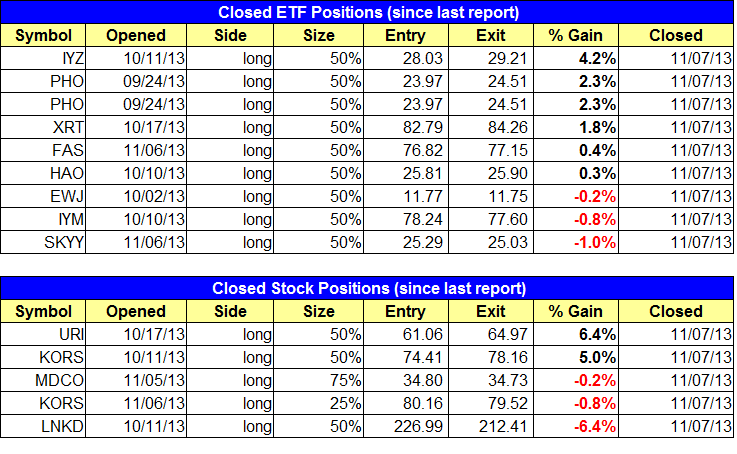
closed positions:
Having trouble seeing the closed positions graphic above? Click here to view it directly on your web browser instead.
ETF position notes:
- Sold all open long positions except for $PPA.
stock position notes:
- Sold all open long positions.
ETF, stock, and broad market commentary:
The current rally took a big hit on Thursday, as leading stocks and broad market averages were smacked around on heavy volume.
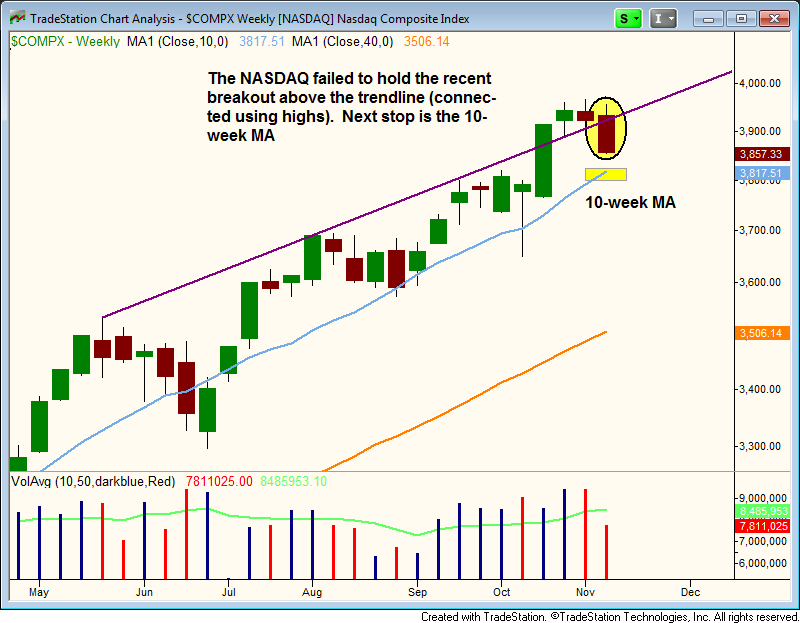
The NASDAQ Composite fell 1.9%, slicing through the 20-day EMA and closing at the lows of the session. On the chart below, Thursday’s selloff put the weekly chart back below the upper trendline, and is more than likely headed to the 10-week MA within the next few days.
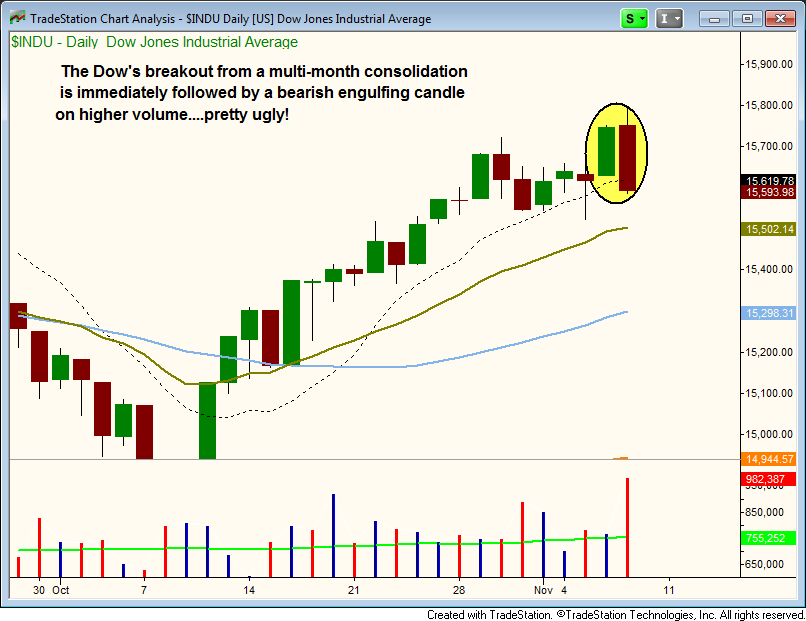
For many investors, the Dow Jones breakout to new highs on Wednesday was a bullish sign. If so, then Thursday’s selloff was an extremely ugly reaction to new highs, as the Dow printed a bearish engulfing candle on higher volume.
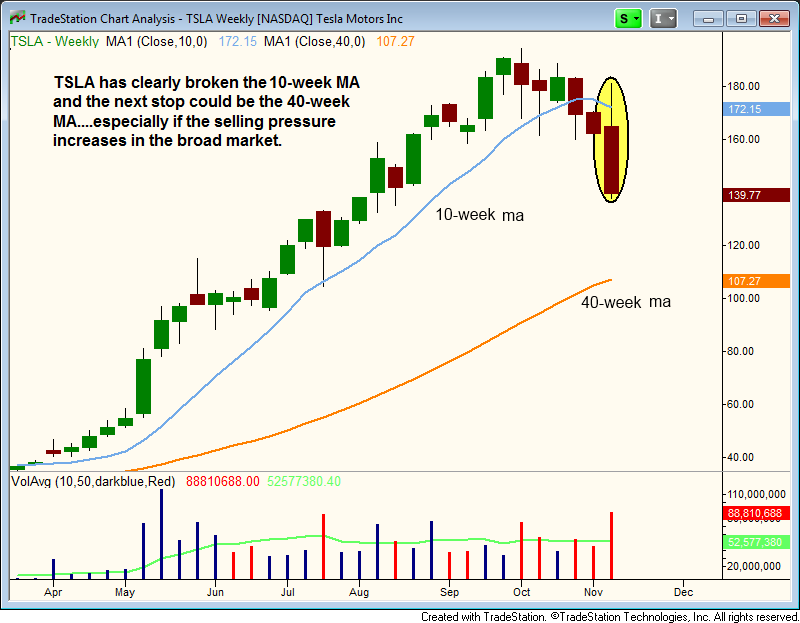
While the Dow Jones moved to new highs on Wednesday, leading stocks like $MELI and $TSLA were down big. $TSLA continued its plunge yesterday, losing 8% on heavy volume. $TSLA is already down 23% from Tuesday’s open.
In yesterday’s report, we mentioned that leading stocks were lagging (and breaking down ahead of) the major averages, which is something we could not ignore. Rather than overstay our welcome, we tightened up stops on existing positions, which allowed us to lock in gains and minimize losses on new entries.
We are now sitting in a 100% cash position on the stock side, and have only one open ETF position in $PPA, which has a very tight stop to protect gains.
The big question is when do we go short? We are a bit too late to grab any exposure right now, but a short-term bounce in the market could produce some decent entry points. We like a few retailers such as $LULU and $URBN on the short side, as well as the real estate ETFs $IYR and $SRS.