market timing model:
Buy – Signal generated on the close of July 27 (click here for more details)
today’s watchlist (potential trade entries):

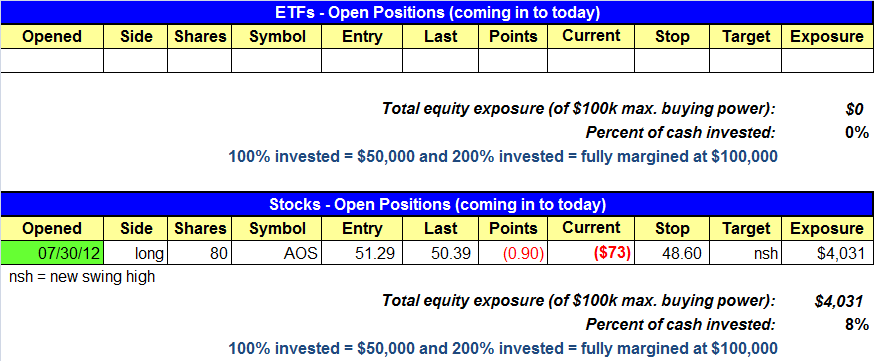
open positions:
Below is an overview of all open positions, as well as a report on all positions that were closed only since the previous day’s newsletter. Net P/L figures are based on two separate $50,000 model portfolios (one for ETFs and one for stocks). Changes to open positions since the previous report are listed in red shaded cells below. Be sure to read the Wagner Daily subscriber guide for important, automatic rules on trade entries and exits.

Having trouble seeing the open positions graphic above? Click here to view it directly on your web browser instead.
closed positions:

Having trouble seeing the closed positions graphic above? Click here to view it directly on your web browser instead.
ETF position notes:
- No trades were made.
stock position notes:
- AOS buy entry triggered.
ETF and broad market commentary:
After two days of strong buying, stocks took a break on Monday, as they closed modestly lower on light trade. All of the major indices ended the session approximately in the bottom third of their respective ranges. However, the intraday ranges were fairly tight, which is a good sign for market bulls. The small-cap Russell 2000 led the move lower, as it posted a 0.6% loss on the day. The Nasdaq dropped 0.4% while the S&P MidCap 400 ended the day down by 0.3%. Blue chip stocks performed slightly better on the day. By the closing bell the S&P 500 posted a small 0.1% decline while the Dow Jones Industrial Average ended the session fractionally lower.
Internals ended the session mixed. Volume fell significantly across the board. On the Nasdaq, turnover slid 29.0% and on the NYSE it fell 26.5%. On the NYSE advancing volume ended at par with declining volume. However, on the Nasdaq, declining volume held the upper hand by a factor of 2.1 to 1. Monday was a neutral day with respect to market internals. The light volume move lower suggests that institutions were on the sidelines yesterday.
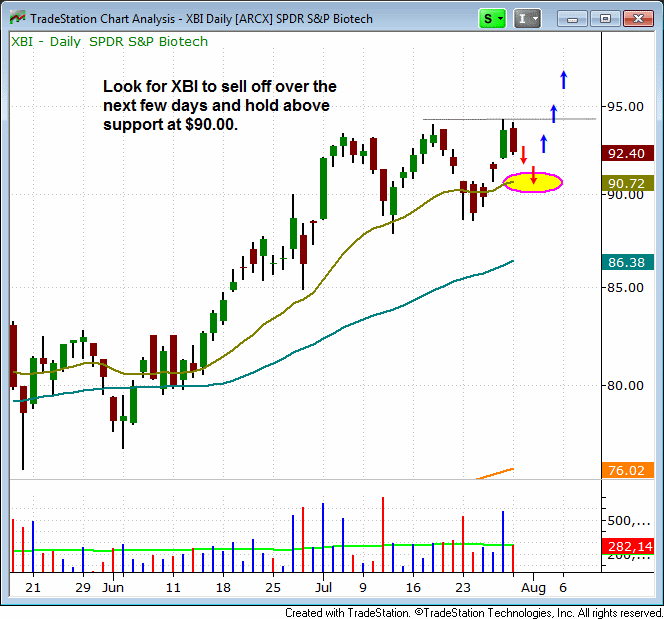
The SPDR S&P Biotech (XBI) has been consolidating in a tight range at the highs the past few weeks. XBI could pull back in to support this week and present us with a low risk entry point if it holds support of the 20-day EMA.

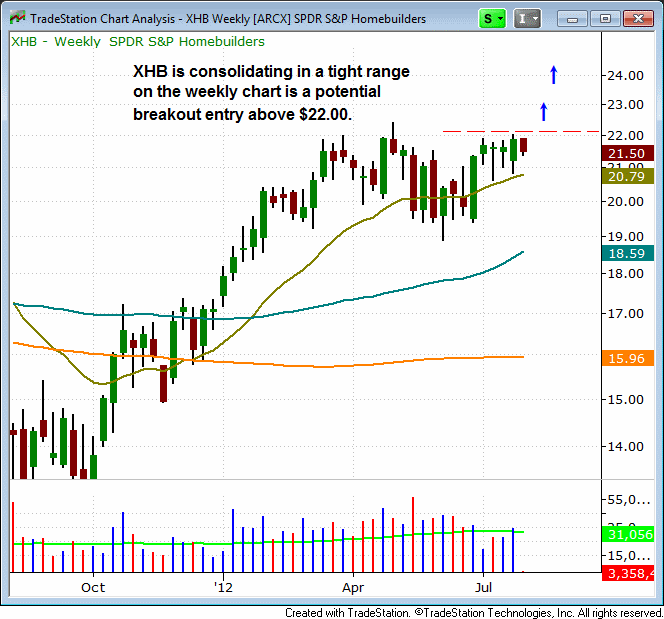
On the weekly chart below, the SPDR S&P Homebuilders (XHB) has formed a 14-week consolidation just below the 52-week high. There are two potential entry points. One is on a breakout above $22.00 and the other is on a pullback to the 21.20 – 21.30 area (the 20-day EMA on the daily chart).

Monday’s consolidation is precisely the type of price action that you would want to see if the market is to move higher. Now that we have a buy signal in the market, low volume selloffs are of little concern. It is important however, how vigorously buyers step in when the market sells off. Institutional buying into weakness would be a sign that the market may be preparing to move higher.
stock commentary:
AOS triggered our buy entry on the open but sold off the rest of the day. The good news is that yesterday’s volume was the lightest volume over the past several weeks. A move above Monday’s high should lead to a new swing high.
AFFY was added to the watchlist and is listed twice due to the split stops. Although AFFY may need more time to digest the recemt move out, we feel that it is worth the risk to enter above the two day high with a tight stop (and reduced share size).
Note: We have replaced the Relative Strength watchlist with the Relative Strength Combo watchlist. This new list combines strong price action with top fundamentals to produce ideal candidates on the long side. Stocks that make this are NOT an automatic buy. Each pattern must be examined for a low risk entry point before any action is taken. The number of stocks on this watchlist will vary depending on market conditions. This list is not a recommendation to buy.
If you are a new subscriber, please e-mail [email protected] with any questions regarding our trading strategy, money management, or how to make the most out of this report.
relative strength combo watchlist:
Our Relative Strength Combo Watchlist makes it easy for subscribers to import data into their own scanning software, such as Tradestation, Interactive Brokers, and TC2000. This list is comprised of the strongest stocks (technically and fundamentally) in the market over the past six to 12 months. The scan is updated every Sunday, and this week’s RS Combo Watchlist can be downloaded by logging in to the Members Area of our web site.