market timing model: Buy
Current signal generated on close of September 9.Portfolio exposure can be anywhere from 50% to 100% long or more, meaning that conditions are strong enough to be on margin (if you are having plenty of success with your buys). You can not just go from 30% invested to 100% when you feel like it, you have to go from 30% to 60 or 75% and if those positions work, then you can add more.Past signals:
- Neutral signal generated on close of August 15
- Buy signal generated on close of July 11
- Neutral signal generated on close of July 5
- Sell signal generated on close of June 24
today’s watchlist (potential trade entries):

Having trouble seeing the open positions graphic above? Click here to view it directly on your web browser instead.
open positions:
Below is an overview of all open positions, as well as a report on all positions that were closed only since the previous day’s newsletter. Changes to open positions since the previous report are listed in pink shaded cells below. Be sure to read the Wagner Daily subscriber guide for important, automatic rules on trade entries and exits.

Having trouble seeing the open positions graphic above? Click here to view it directly on your web browser instead.
closed positions:
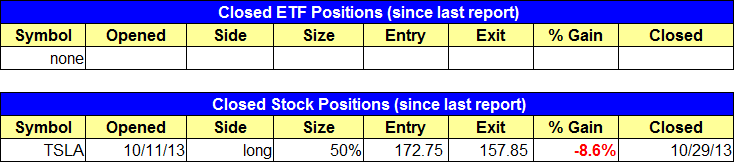
Having trouble seeing the closed positions graphic above? Click here to view it directly on your web browser instead.
ETF position notes:
- Canceled the $FM setup for now
stock position notes:
- Stopped out of $TSLA.
ETF, stock, and broad market commentary:
The Dow Jones led the market higher on Tuesday with a 0.7% gain, and is closing in on resistance from prior swing highs in the 15,600 to 15,700 range.
The S&P 500 was close behind, with a clear breakout and 0.6% gain after a four day pause.
Money has rotated into the S&P 500 and Dow in the short-term, as small and mid-cap stocks, along with the NASDAQ Composite have lagged as of late. That being said, the NASDAQ is still in good shape with recent breakaway gap ups in $GOOG and $AMZN working.
Although leading stocks such as $TSLA, $KORS, $LNKD, $YELP, and $YNDX have lagged the S&P 500, many of these stocks are simply trading sideways into earnings. How these stocks and others react to earnings will be key.
After forming a bullish reversal candle on big volume during the second week of October (off the 10-week MA in blue), iShares U.S. Basic Materials ETF ($IYM) broke out to new 52-week highs on heavy volume the following week.
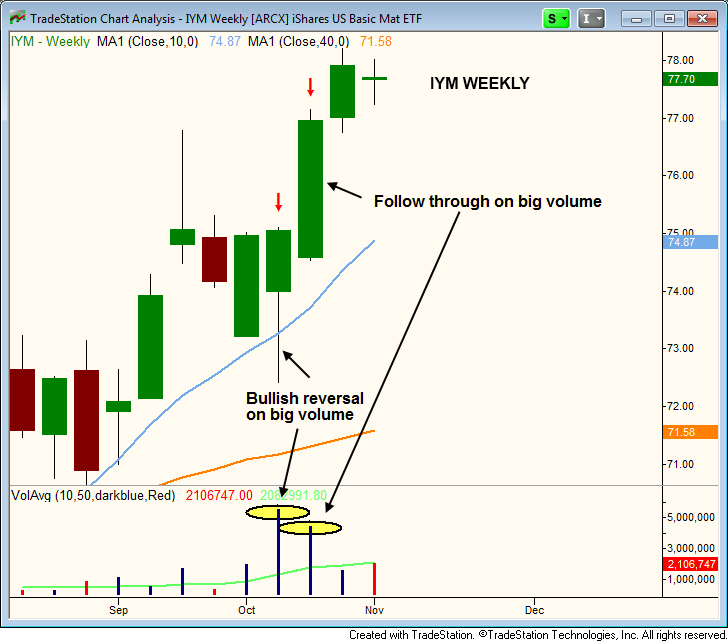
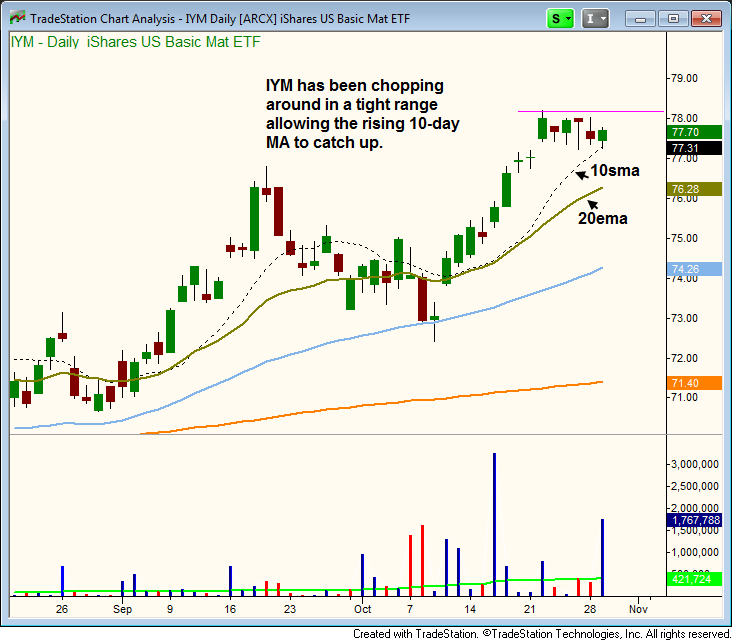
The sharp move off the 50-day MA on the daily chart below found resistance around $78, where $IYM has since formed a bull flag type consolidation, which is a shallow correction by time (not by price).
We look for $IYM to hold above the 10-day MA, minus a shakeout day or two, and resume its uptrend within the next few days. We are placing $IYM on today’s watchlist. The entry, stop, and target prices can be found above.
Our $FM buy entry did not officially trigger on Tuesday, as the price action hit our entry within the first 5-minutes of trading, so the 5-minute rule applied. Although we like $FM as a setup, we are taking it off today’s watchlist to see how it reacts to yesterday’s false trigger.
On the stock side we placed a tight stop in $SLCA for the entire 40% position to lock in a 50% gain (it is no longer a split stop). Rather than sitting through a potential 4-5 week correction, we decided to lock in gains and look to rotate the money into a setup that is more actionable.
$TSLA stopped us out, but the setup remains alive due to Tuesday’s bullish reversal action. For now, we plan to stay out of $TSLA’s way until it reports earnings.
$YELP and and $LNKD reported earnings after the close on Tuesday. $YELP closed nearly 9% lower in after hours trading, while while LNKD lost about 2%. Note the new stop in $YELP to guard against a breakdown below the 50-day MA.
With so many stocks reporting earnings the next two weeks, there isn’t much out there to buy.
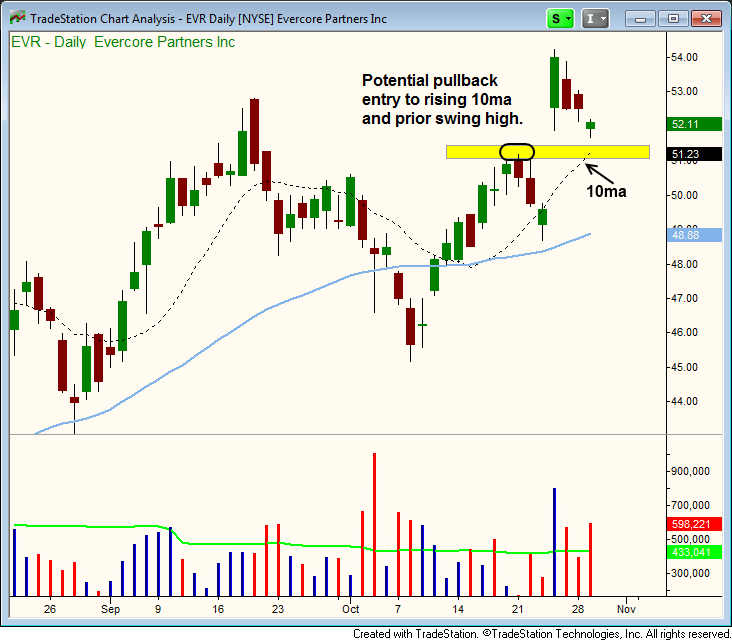
$EVR is a potential pullback entry in an A rated stock that has already reported earnings. There is support from the rising 10-day MA and the prior swing high around $51.25. We’d like to see some sort of bullish reversal candle print around the 10-day MA, to provide us with a low risk entry point.