Current signal generated on close of August 15.
Portfolio long exposure can be anywhere from 30% to 100% (if your stocks are holding up).
Past signals:
- Buy signal generated on close of July 11
- Neutral signal generated on close of July 5
- Sell signal generated on close of June 24
today’s watchlist (potential trade entries):

Having trouble seeing the open positions graphic above? Click here to view it directly on your web browser instead.
open positions:
Below is an overview of all open positions, as well as a report on all positions that were closed only since the previous day’s newsletter. Changes to open positions since the previous report are listed in pink shaded cells below. Be sure to read the Wagner Daily subscriber guide for important, automatic rules on trade entries and exits. Click here to learn the best way to calculate your share size.

Having trouble seeing the open positions graphic above? Click here to view it directly on your web browser instead.
closed positions:
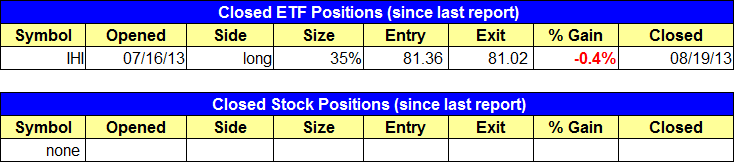
Having trouble seeing the closed positions graphic above? Click here to view it directly on your web browser instead.
ETF position notes:
- Sold remaining $IHI shares for small loss. Total % gain on trade was basically a scratch due to the gap downs below our stops.
stock position notes:
- No trades were made.
ETF, stock, and broad market commentary:
Market conditions continue to weaken, as stocks closed in negative territory for the fourth session in a row. With the exception of the NASDAQ Composite, all major averages are trading below the 50-day MA, which is our line in the sand for a bull market. With the NYSE and NASDAQ volume patterns turning bearish and most indices below the 50-day MA, top tier leadership stocks is the only part of the timing model that is holding up. If true leaders such as $LNKD, $KORS, and $TSLA begin to break down, along with other institutional favorites $GILD, $CELG, $GOOG, $AMZN, and $PCLN, then the timing model will be forced into sell mode and we’ll begin to establish short positions.
In yesterday’s report we mentioned the recent money flow into precious metals, and the relative strength in iShares Silver Trust ($SLV) over SPDR Gold Trust ($GLD), due to the strong separation from the 10-week MA and heavier volume in $SLV. With $SLV stalling stalling out the past two sessions, we could potentially see a bull flag type pattern emerge by the end of the week on the daily chart. Rather than buying $SLV, we are going with the 2x leveraged, ProShares Ultra Silver ETF ($AGQ). The daily chart below details the potential setup with our ideal price action over the next few days.

The move off the recent swing low in $AGQ was about six days in length, forming the mast portion of the bull flag pattern. The past two days of stalling action begins the flag, which has yet to flesh itself out and will need a few more days of sideways chop to do so. From what we have seen over the years, the best bull flag patterns tend to have a flag that is equal to or less than the number of days in the mast. For example, if the run up (mast) was seven days in length, the flag should be anywhere from three to seven days in length. If the flag portion takes longer than seven to eight days to go, it could be that the stock/ETF is not ready to go and will need more time to consolidate.
If $AGQ does trigger, we are looking for the price action to fill the large gap down created on April 15 as the target, just below $32.

The stop is placed just beneath the low of August 15, which is about 14% away, but with a target of $31.70 (34% gain), we still have a solid 2.4 to 1 reward to risk ratio in place. Please note that this is a counter-trend, momentum swing trade, which we sometimes take in commodity based setups, as they have the potential to trend really well after a strong reversal. Because of this, we are reducing our share size to a 35% position. Since this is a fairly quick momentum trade (1-3 weeks), we do not mind using $AGQ over $SLV. However, when momentum fades, the leveraged products tend to under perform the underlying (do not buy and hold $AGQ).
We have tightened up stops on $BWEN and $CCUR, as these are the stocks that tend to take a beating when market conditions weaken. Depending on how our stocks hold up, we may be able to sit through a correction and could be in great shape during the next move up (if conditions stabilize).
With market leadership narrowing, our focus is now on the top 5 or so stocks in the market. $KORS has recently pulled back to the rising 20-day EMA after a base breakout. The current pullback is only 7% off the swing high, while volume during the decline has been below average. The lack of heavy volume selling is a bullish sign, so we are looking to establish a position with 1/3 our max risk over Monday’s high. The stop is below Monday’s low, as the price should not return back below this level once triggered.
