ETFs and market commentary:
Stocks closed modestly higher yesterday on brisk trade. All five major indices finished in positive territory, with the Nasdaq showing the most resiliency. The tech-rich index added 0.4%. The S&P 500 gained 0.2% while both the small-cap Russell 2000 and the S&P MidCap 400 added 0.1%. The Dow Jones Industrial Average ended the session fractionally higher. Sectors showing the most strength included oil services, internet, emerging markets, solar energy and networking. Weaker sectors included natural gas, healthcare, pharmaceuticals and transportation.
For a second consecutive day market internals provided a modestly bullish signal. Volume increased on the Nasdaq by 10.9% and on the NYSE by 6.9%. Advancing volume outpaced declining volume by a factor of 1.5 to 1 on the NYSE and 1.8 to 1 on the Nasdaq. The Nasdaq qualified for an accumulation day yesterday, as it posted a gain of more than 0.3% and saw both total volume and advancing volume finish higher.
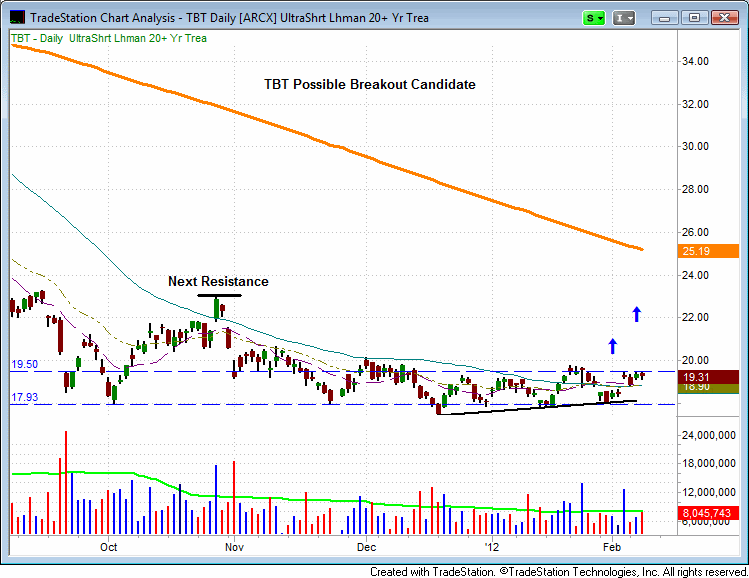
Since October, 2011, the UltraShort Lehman 20yr + Treasury Fund (TBT) has been consolidating between $18.00 and $19.75, and appears to be forming a base from which to launch a possible reversal move. Further, TBT has also been setting a sequence a higher-lows over the past several weeks. If TBT can move above the two day high of $19.50 on a pickup in volume, it may present a buying opportunity. We are monitoring TBT for as a potential long candidate.
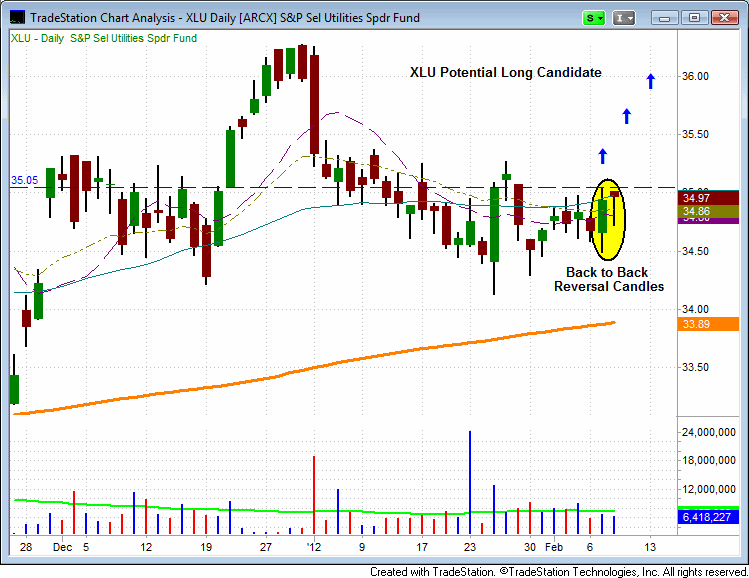
In yesterday’s newsletter we stated; “the S&P Select Utilities SPDR Fund (XLU) undercut the four day low and reversed to close near session highs. A volume fueled rally above yesterday’s high of $35.04 could present a buy entry trigger for this ETF”. During yesterday’s session, XLU formed its second reversal candle in a row and closed near key resistance. We are adding XLU to the watchlist. Trade details are posted in the watchlist section of the newsletter.
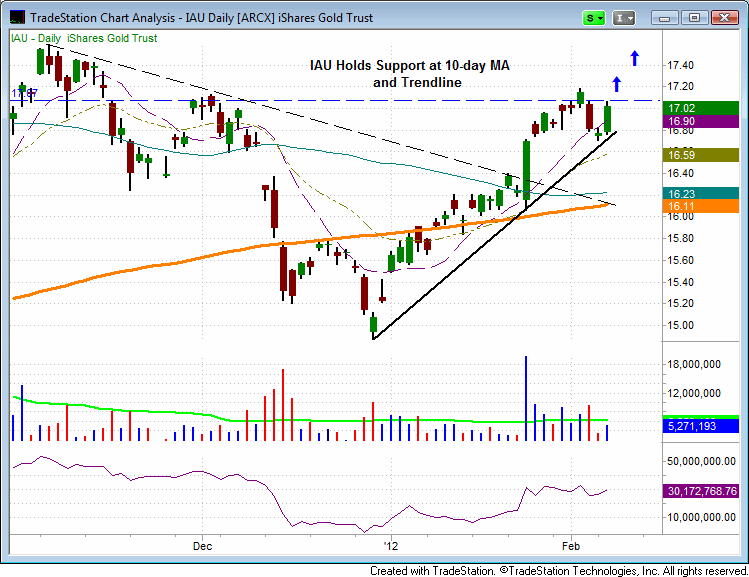
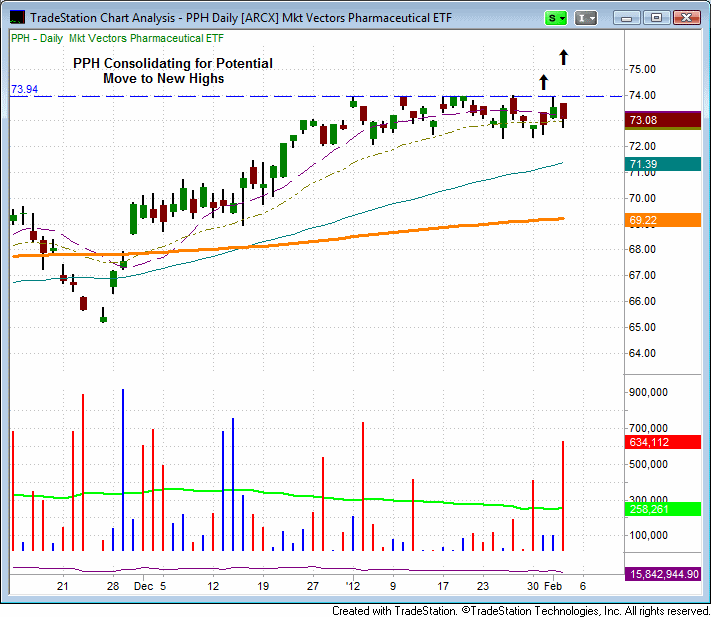
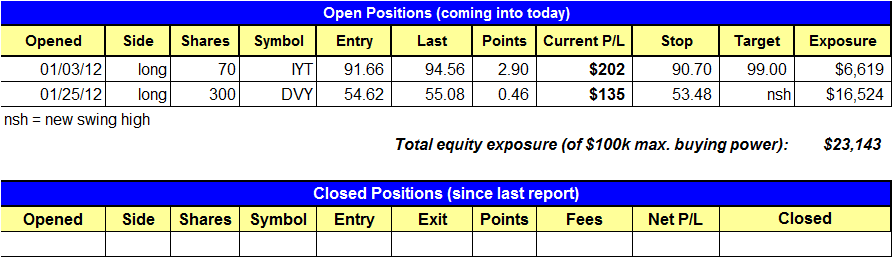
DVY posted a fresh 52-week high yesterday and IYT held support at its 2-day low. Both trades continue to perform well as the market consolidates. Our watchlist candidates, IAU and PPH both recovered nicely after testing support near the two day low. Although the broad market finished higher on Wednesday, it didn’t make much progress. This is a bit surprising given the higher volume. It is noteworthy that we did see some selling into strength yesterday. We haven’t seen that type of price action in quite some time. However, the intraday recovery washed away most concerns that had from the early session selling pressure.
XLU
Long
Shares = 500
Trigger = 35.12
Stop = 34.38
Target = 36.60
Dividend Date = n/a
Notes = See commentary above
IAU
Long
Shares = 800
Trigger = 17.13
Stop = 16.47
Target = new swing high
Dividend Date = n/a
Notes = See commentary from Feb. 8 report
PPH
Long
Shares = 300
Trigger = 74.04
Stop = 72.22
Target = new swing high
Dividend Date = n/a
Notes = We’ve been monitoring this trade for potential entry and it remains on our watchlist.
Daily Performance Report:
Below is an overview of all open positions, as well as a performance report on all positions that were closed only since the previous day’s newsletter. Net P/L figures are based on the $50,000 Wagner Daily model account size. Changes to open positions since the previous report are listed in red text below. Please review the Wagner DailySubscriber Guide for important, automatic rules on trigger and stop prices
Having trouble seeing the position summary graphic above? Click here to view it directly on your Internet browser instead.
Notes:
- No trades were made.
- Reminder to subscribers – Intraday Trade Alerts to your e-mail and/or mobile phone are normally only sent to indicate a CHANGE to the pre-market plan that is detailed in each morning’s Wagner Daily. We sometimes send a courtesy alert just to confirm action that was already detailed in the pre-market newsletter, but this is not always the case. If no alert is received to the contrary, one should always assume we’re honoring all stops and trigger prices listed in each morning’s Wagner Daily. But whenever CHANGES to the pre-market stops or trigger prices are necessary, alerts are sent on an AS-NEEDED basis. Just a reminder of the purpose of Intraday Trade Alerts.
- For those of you whose ISPs occasionally deliver your e-mail with a delay, make sure you’re signed up to receive our free text message alerts sent to your mobile phone. This provides a great way to have redundancy on all Intraday Trade Alerts. Send your request to [email protected] if not already set up for this value-added feature we provide to subscribers.
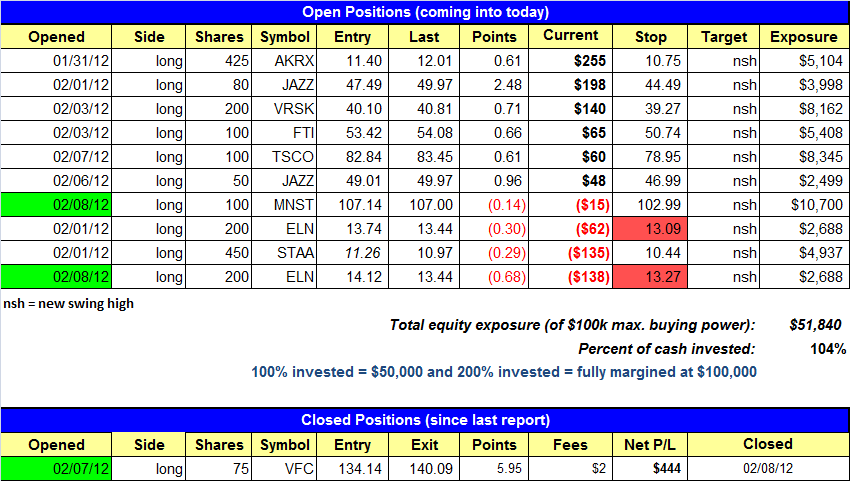
MNST triggered its buy entry off the Stock Watchlist yesterday. It ripped higher early in the day but sold off with the market and closed near our entry. We’d like to see the price action hold above the Feb. 8 low (minus some wiggle room) over the next few days and eventually push higher. Per intraday alert, we added 200 shares to our position in ELN after it formed a very bullish reversal candle and cleared the three day high. ELN failed to hold up and closed with an ugly reversal candle. Please note the separate stops for ELN in the Open Positions section below.
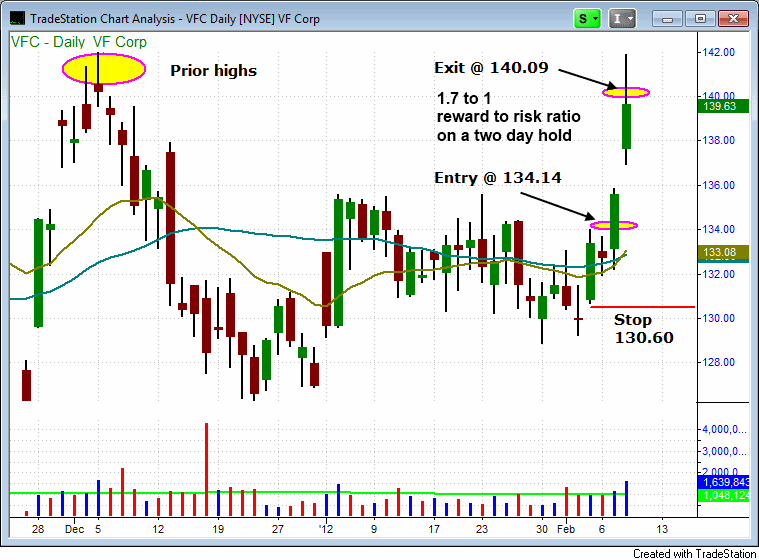
Per intraday alert, we sold VFC in the morning to take advantage of a six point move in two days. With VFC approaching the prior highs we decided to take the easy money and run. We gained about 4.4% on the trade while risking 2.6%, which is a 1.7 to 1 reward to risk ratio (pretty good for a two-day hold).
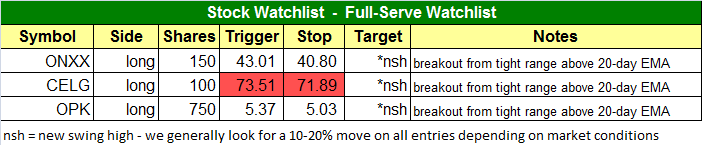
NOTE: We are changing the name of the Full-Serve watchlist to the “Stock Watchlist” to reduce confusion so that both newsletters use the same terminology. Because of this, we will no longer have a Self-Serve watchlist.
Daily Stock Summary
Below is an overview of all “full-serve” open positions, as well as a performance report on all “full-serve” positions that were closed only since the previous day’s newsletter. Net P/L figures are based on the $50,000 model account size. Changes to open positions since the previous report are listed in red text below.
Having trouble seeing the position summary graphic above? Click here to view it directly on your Internet browser instead.
Notes:
- MNST buy entry triggered.
- Per intraday alert, sold VFC to lock in a quick gain.
- Per intraday alert, added 200 shares to ELN.
- JAZZ and ELN are listed twice due to separate stops.
Relative Strength Watchlist:
The Relative Strength (or RS) Watchlist makes it easy for subscribers to import data into their own scanning software, such as Tradestation, Interactive Brokers, and TC2000. The list is comprised of the strongest 100 (or so) stocks in the market over the past six to 12 months. The scan is based on the following criteria and is updated every Monday:
- Stock is in a well defined uptrend, trading above both the 50-day and 200-day moving averages, with the 50-day moving average above the 200-day moving average (both moving averages should be in an uptrend as well).
- Today’s close is less than 20% off the 52-week high
- Close is greater than $5.
- Volume is greater than 200,000 shares per day (using a 50-day volume moving average).
Click here to view this week’s Relative Strength Watchlist in excel
Click here to view this week’s Relative Strength Watchlist as a text file