Sell Mode
– Timing model generated sell signal on close of April 3 (click here for more details)
Note the position sizing in $VXZ. The size is now based on a $100,000 portfolio. A typical full sized loss should now be around 1% of account equity or $1,000. A half position is 0.5% of account equity or $500.
today’s watchlist (potential trade entries):

Having trouble seeing the open positions graphic above? Click here to view it directly on your web browser instead.
open positions:
Below is an overview of all open positions, as well as a report on all positions that were closed only since the previous day’s newsletter. Net P/L figures are based on two separate $50,000 model portfolios (one for ETFs and one for stocks). Changes to open positions since the previous report are listed in pink shaded cells below. Be sure to read the Wagner Daily subscriber guide for important, automatic rules on trade entries and exits.

Having trouble seeing the open positions graphic above? Click here to view it directly on your web browser instead.
closed positions:

Having trouble seeing the closed positions graphic above? Click here to view it directly on your web browser instead.
ETF position notes:
- $VXZ sell stop triggered and we are out. $UNG and $OIH buy stops triggered.
stock position notes:
- No trades were made.
ETF, stock, and broad market commentary:
Market conditions continue to stabilize, as stocks followed through on Friday’s bullish reversal action with respectable gains across the board. Once again, the broad market averages are fighting off 5-days of distribution that produced a sell signal in our timing model. Please remember that our timing model was created to react to price action, not predict. Whenever there are 5-distribution days in a major index and leading stocks sell off on heavy volume it it is always a major concern. However, if the market is able to fight off the distribution and BULLISH STOCK SETUPS are found, then we must buy. Sometimes it is easy to forget that we are trading stocks/ETFs and not the stock market averages.
Our scans the past few days have produced several high quality buy setups. Yesterday, we added long positions in $OIH and $UNG to the portfolio, and we have several new buy candidates on today’s watchlist.
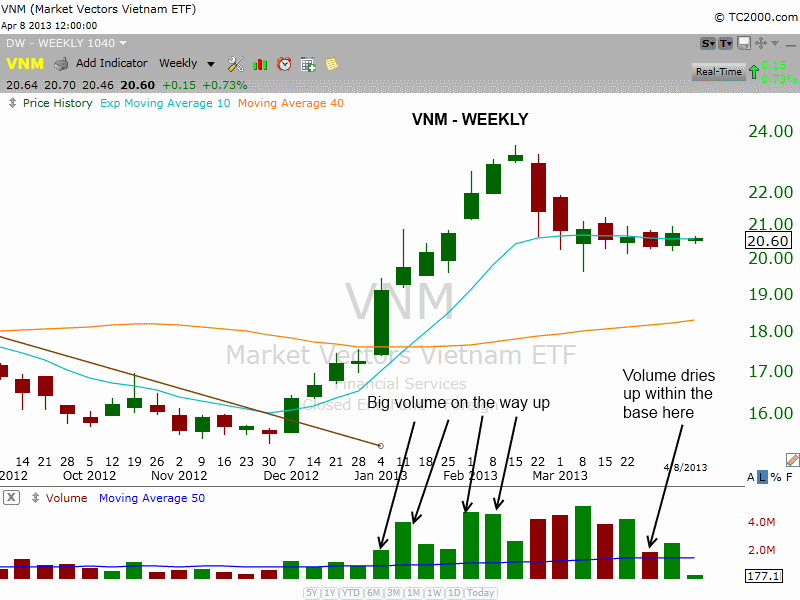
One of the best looking country ETF charts we found was the Market Vectors Vietnam ETF ($VNM). The weekly chart is quite powerful, as it shows the huge pick up in volume during the rally as the price action cleared the 40-week MA (in orange). The price action is now consolidating in a tight range around 10-week MA (teal line). Note the dry up in volume two weeks ago, which indicates that investors have lost interest in trading $VNM as it continues to base out.

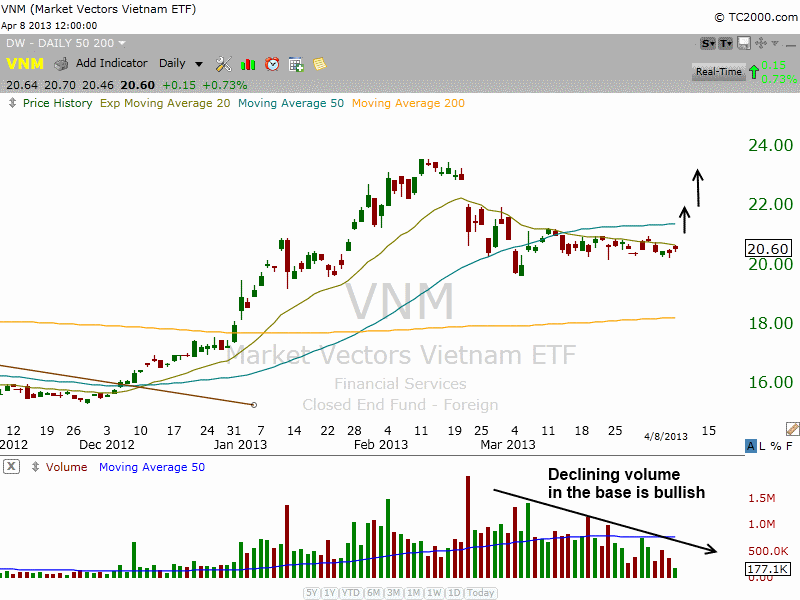
The daily chart in $VNM shows the tight price range just below the 20-day EMA. We can easily see the nice drop off in volume since March 27 as well. A break above the three-day high is our buy entry, as this would put the price action above the 20-day EMA and the short-term downtrend line of the tight range. A break above $21 would also confirm that a higher swing low is in place on the daily chart.

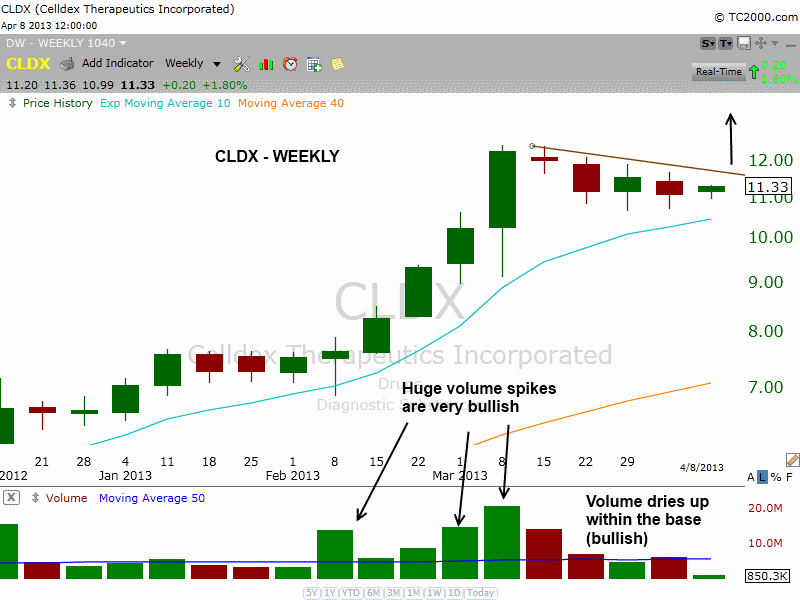
On the stock side, we have a few new buy setups listed. $LNKD, $KKD, and $AMBA are A rated setups with solid fundamentals. $CLDX does not have explosive earnings growth, but its relative strength ranking is 98 and the price and volume action on the weekly chart has been impressive. Note the huge volume spikes on the move above $8.

Our buy entry is over Monday’s high, which is already above the two-day high. This entry should lead to a break of the downtrend line within the base on the weekly chart above.
relative strength combo watchlist:
Our Relative Strength Combo Watchlist makes it easy for subscribers to import data into their own scanning software, such as Tradestation, Interactive Brokers, and TC2000. This list is comprised of the strongest stocks (technically and fundamentally) in the market over the past six to 12 months. The scan is updated every Sunday, and this week’s RS Combo Watchlist can be downloaded by logging in to the Members Area of our web site.