market timing model:
Sell – Signal generated on the close of October 12 (click here for more details)
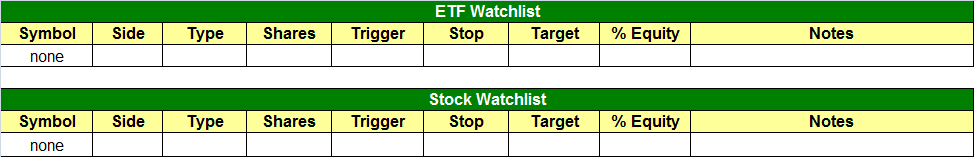
today’s watchlist (potential trade entries):
Having trouble seeing the open positions graphic above? Click here to view it directly on your web browser instead.
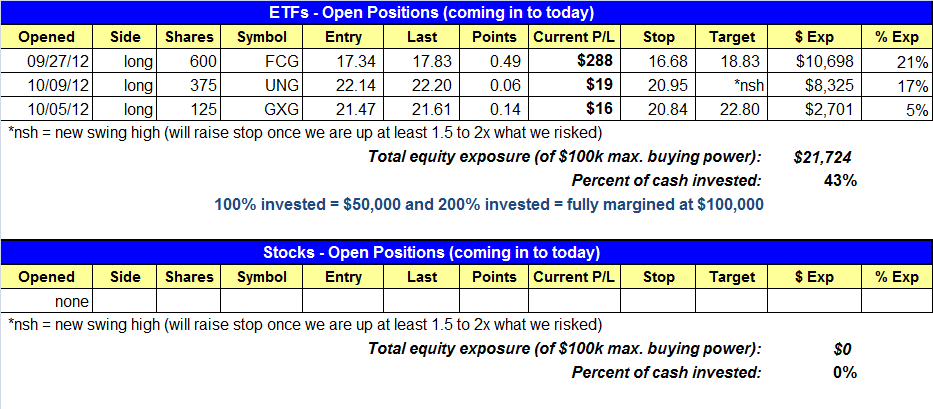
open positions:
Below is an overview of all open positions, as well as a report on all positions that were closed only since the previous day’s newsletter. Net P/L figures are based on two separate $50,000 model portfolios (one for ETFs and one for stocks). Changes to open positions since the previous report are listed in pink shaded cells below. Be sure to read the Wagner Daily subscriber guide for important, automatic rules on trade entries and exits.
Having trouble seeing the open positions graphic above? Click here to view it directly on your web browser instead.
closed positions:

Having trouble seeing the closed positions graphic above? Click here to view it directly on your web browser instead.
ETF position notes:
- No trades were made.
stock position notes:
- No trades were made.
ETF and broad market commentary:
Stocks jumped out of the gate yesterday and did not look back in what was a strong morning session that saw most averages up 1.0% or more by 12 pm. Although the averages did not extend higher in the afternoon session they were able to digest gains and rally in to the close to finish at the highs of the day. Much like Monday’s performance, the percent gains were in a tight range across the board with the Nasdaq Composite leading the way at 1.2%. The S&P Midcap 400 Index ($MID) was right behind at 1.1%. Both the S&P 500 Index ($SPX) and Dow Jones Industrial Average ($DJIA) closed up 1.0%. The The small-cap Russell 2000 Index ($RUT) added 0.9%. All the major averages closed in the top 5% of the day’s range.
Institutions were in buy mode once again as turnover increased across the board. Total volume increased by 10% on the Nasdaq and 6% on the NYSE. In both exchanges, trade was heavier than the 50-day average. Advancing volume out paced declining volume by a healthy 3.8 to 1 ratio on the NYSE. The Nasdaq ADV/DEC ratio was a very ordinary 2 to 1. It was a solid session for a market that is rallying from deeply oversold levels.
While Spain and Greece were very much the focal point of Wall Street for Q1-Q2 of 2012, the price action in the iShares MSCI Spain Index (EWP) is quietly making a nice comeback. After a strong rally off the summer low which broke the weekly downtrend line, $EWP stalled out at resistance around $30.00. A breakout above $30.00 should find resistance at a weekly downtrend line around $35.00.

Dropping down to a daily chart we see that the short-term downtrend line has been broken, which means that $EWP should now form the right hand side of the base and continue to set higher swing lows above the 50-day MA. $EWP has yet to form a low risk buy point so we will just continue to monitor the action for now.

The financial sector is also forming a bullish consolidation pattern above the 50-day MA. The daily chart of the Financial Select Sector SPDR ($XLF) is in pretty good shape and showing a bit of relative strength the past few weeks. $XLF has set a higher swing low while the S&P 500 undercut the prior swing low and the 50-day MA. We look for the price action to tighten up over the next week or two to provide us with a low risk entry point.

The weekly chart of $XLF shows clear resistance at $17.00, which would be an easy target for a breakout trade if/when it triggers.

Monday’s false breakout in the United States Natural Gas Fund ($UNG) will probably send the price action down to test the 20-day EMA. We usually see false breakouts lead to a two to five day sell off that washes out the late to the party longs (and even those who bought at the right time). The best case scenario right now is for UNG to test the 20-day EMA with a bullish reversal bar while setting a higher swing low.

So far the market has put in a solid reversal day and a strong follow through day off the lows. However, the big question here is will the Nasdaq and the small cap Russell 2000 act as a drag on the market. Both of these averages showed relative weakness to the S&P 500 by breaking a prior swing low and have more resistance to clear before getting back on track.
stock commentary:
We remain on the sidelines waiting for the market to put in a bullish, follow through day to confirm that a new rally is potentially under way. This follow through day is a little different than what most traders consider a follow through day. A normal follow through day is where a stock or index puts in back to back accumulation days. However, a follow through day to confirm a market rally is when a major average rallies 1.5% or so on higher volume. Once our follow through day is in we can begin to buy stocks with solid basing patterns and low risk entry points.
KORS broke out on strong price and volume action yesterday. For those who bought the unofficial setup in KORS you can continue to hold the position with a stop below 51.60 if you bought with reduced share size. In holding KORS you are looking for the stock to show relative strength even if the market pulls back later this week or next. For those who just want to take the quick gain look to sell KORS into strength if it gaps up to new highs tomorrow morning.
A few more stocks wto add to the watchlist are: SNTA, SPF, PCRX, ULTI, CRAY, GIB, CRM, and LEDR (although this is a light volume issue).
If you are a new subscriber, please e-mail [email protected] with any questions regarding our trading strategy, money management, or how to make the most out of this report.
relative strength combo watchlist:
Our Relative Strength Combo Watchlist makes it easy for subscribers to import data into their own scanning software, such as Tradestation, Interactive Brokers, and TC2000. This list is comprised of the strongest stocks (technically and fundamentally) in the market over the past six to 12 months. The scan is updated every Sunday, and this week’s RS Combo Watchlist can be downloaded by logging in to the Members Area of our web site.