market timing model: BUY
Current signal generated on close of November 13.
Portfolio exposure can be anywhere from 75 to 100% long. If positions are holding up well, then one can add exposure beyond 100% (for experienced traders only).
Past signals:
- Neutral signal generated on close of November 6.
- Buy signal generated on close of September 9
- Neutral signal generated on close of August 15
- Buy signal generated on close of July 11
- Neutral signal generated on close of July 5
- Sell signal generated on close of June 24
today’s watchlist (potential trade entries):

Having trouble seeing the open positions graphic above? Click here to view it directly on your web browser instead.
open positions:
Below is an overview of all open positions, as well as a report on all positions that were closed only since the previous day’s newsletter. Changes to open positions since the previous report are listed in pink shaded cells below. Be sure to read the Wagner Daily subscriber guide for important, automatic rules on trade entries and exits.

Having trouble seeing the open positions graphic above? Click here to view it directly on your web browser instead.
closed positions:
Having trouble seeing the closed positions graphic above? Click here to view it directly on your web browser instead.
ETF position notes:
- No trades were made.
stock position notes:
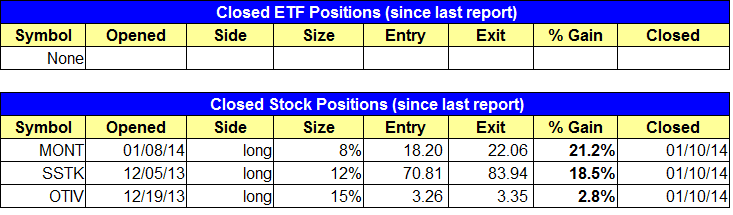
- Sold $OTIV full position for small gain. Sold partial $SSTK for an 18% gain, and sold partial $MONT for 20% gain.
ETF, stock, and broad market commentary:
Mid-cap stocks led the market higher with a 0.7% advance, pushing the S&P 400 to new highs. The NASDAQ Composite, Russell 2000, and S&P 500 all closed in positive territory and continue to trade in a tight range just off the swing highs. All major averages are in pretty good shape, so the odds favor the market eventually moving higher.
For those who missed the original breakout entry in Guggenheim Shipping ETF ($SEA), the current short-term consolidation pattern is bullish and should lead to a continuation breakout.
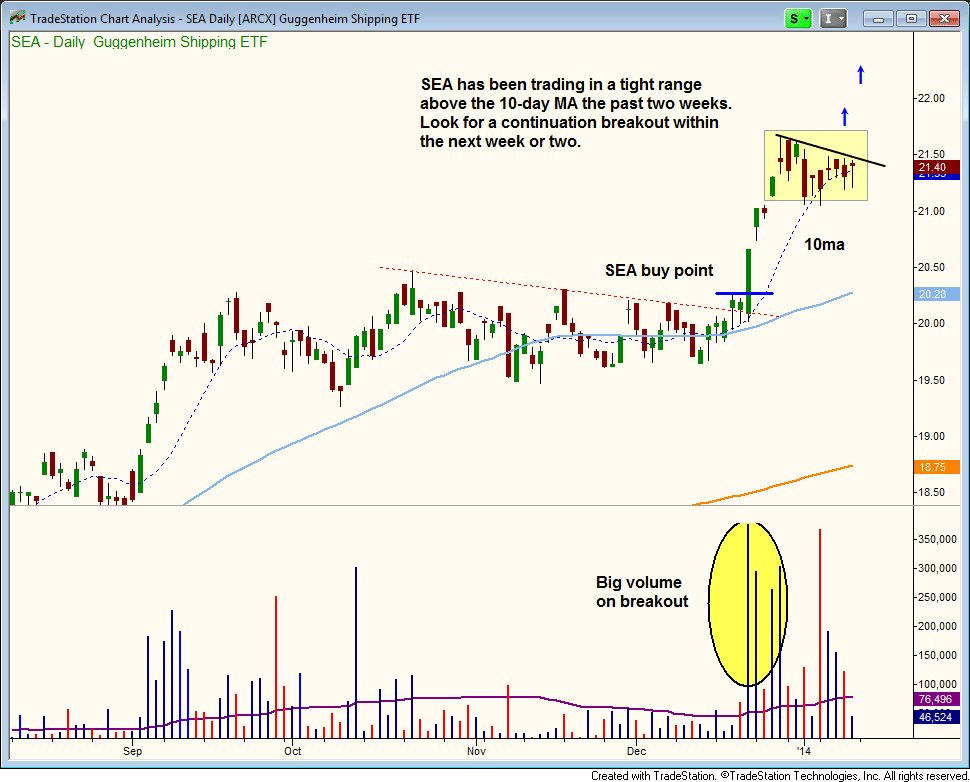
The big volume and strong price action is exactly what we like to see on a breakout, so the utprend should resume after a short-term break.
Even if $SEA fails to push higher and pulls back in, the 50-day MA is already at our original entry point and climbing higher, so there is quite a bit of support below.
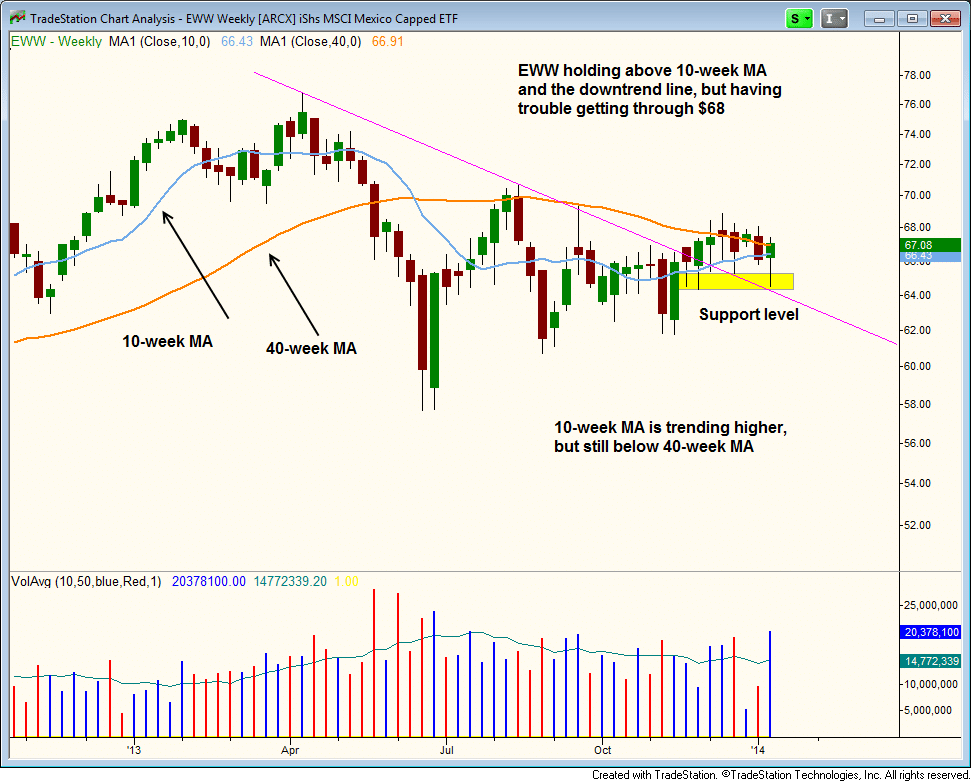
For those who like to play it slow, iShares MSCI Mexico ETF ($EWW) continues to find support at the $65 level from prior all-time highs.
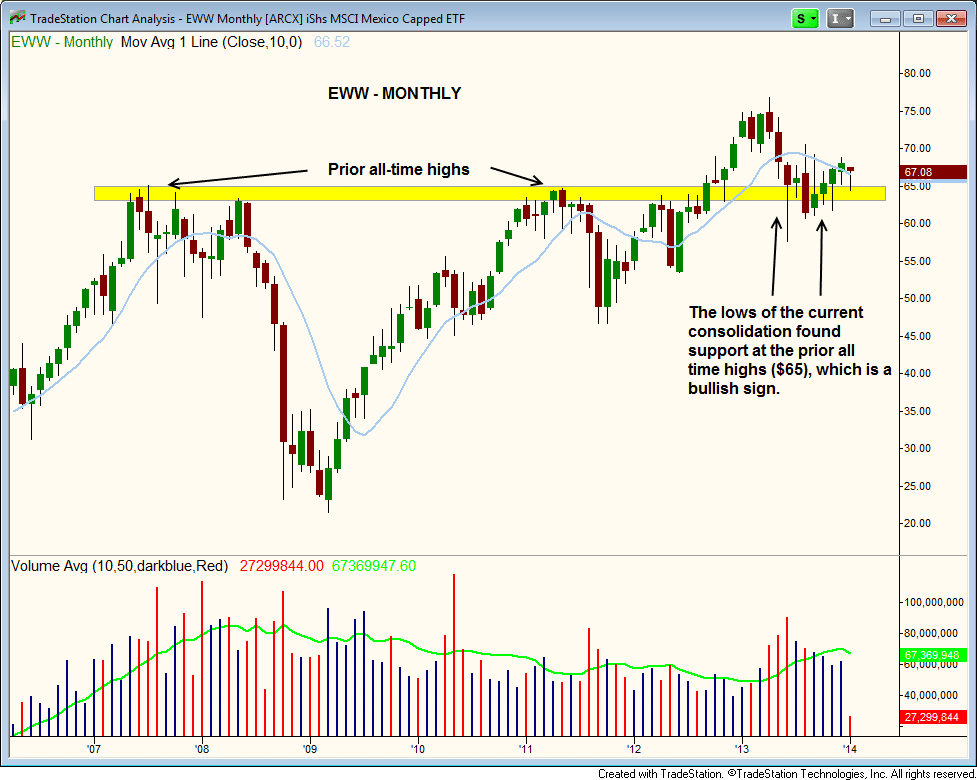
When a stock/ETF breaks out to new all-time highs, the first pullback to this area is typically a solid support level (give or take a few points). Although a few bars have dipped below $65, support is a more about a zone rather than some line on a chart.
On the weekly chart, we see that $EWW formed a bullish reversal candle last week on a pick up in volume. A move above the highs of last week’s reversal candle is a potential buy entry for a starter position. We would not enter with a full position here because the price is too far off the highs of the current base, but establishing a small position and looking to add on strength is fine.
On the stock side, we sold all of $OTIV when it hit our stop. We sold partial size in $MONT and $SSTK, locking in a 20% and 18% gain respectively.
Note that we plan to take profits in $TKMR with a sell on the open. Note the tight stops in $MONT and $TOWR. We lowered the stop in $SSNI to give the setup a bit more breathing room after Friday’s advance.
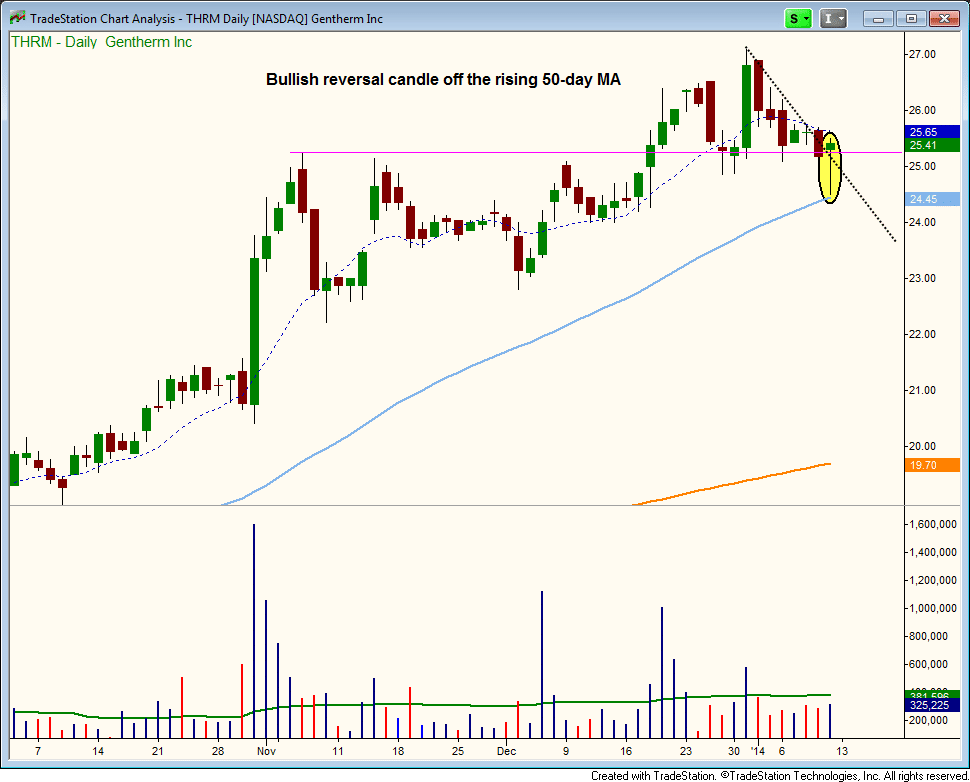
We have one new buy setup on today’s watchlist in Gentherm – $THRM. $THRM has an EPS ranking of 98 and an RS ranking of 91. The price action formed a bullish reversal candle just above the 50-day MA after a false breakout to new highs. This is the first touch of the 50-day MA since September of last year. If $THRM is to continue trending higher and follow through on a breakout from the current consolidation at $25, then it should hold above Friday’s low and the 50-day MA.