Current signal generated on close of August 15.
Portfolio long exposure can be anywhere from 30%-50% if you just joined the letter, or up to 100% (if your stocks are holding up).
Past signals:
- Buy signal generated on close of July 11
- Neutral signal generated on close of July 5
- Sell signal generated on close of June 24
today’s watchlist (potential trade entries):

Having trouble seeing the open positions graphic above? Click here to view it directly on your web browser instead.
open positions:
Below is an overview of all open positions, as well as a report on all positions that were closed only since the previous day’s newsletter. Changes to open positions since the previous report are listed in pink shaded cells below. Be sure to read the Wagner Daily subscriber guide for important, automatic rules on trade entries and exits. Click here to learn the best way to calculate your share size.

Having trouble seeing the open positions graphic above? Click here to view it directly on your web browser instead.
closed positions:
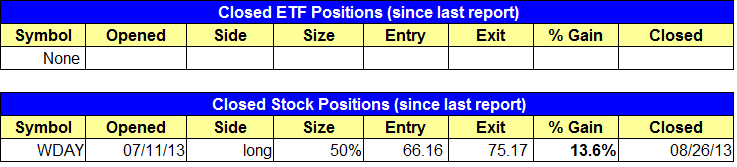
Having trouble seeing the closed positions graphic above? Click here to view it directly on your web browser instead.
ETF position notes:
- Note the new stop prices above.
stock position notes:
- $WDAY stop triggered and we are out with a 13% gain. $BERY second entry point triggered. $DDD buy setup did not trigger and the setup is cancelled for now.
ETF, stock, and broad market commentary:
Stocks rallied about 0.5% in the morning session, pushing the NASDAQ Composite to within 0.3% of the prior high. The morning surge may have been just enough to entice a few bears out of the cave and start buying in anticipation of a move to new highs in the NASDAQ, but the party did not last long, as stocks sold off sharply just after 3 pm, erasing the morning advance. All indices closed near the lows of the day due to the late selling, with only small and mid-caps barely finishing in positive territory. As we mentioned last week, although the NASDAQ is in decent shape, the S&P 500 has failed to reclaim the 50-day MA and the Dow Jones is nowhere near the 50-day MA. This divergence most likely points to the market needing to consolidate for a few weeks. .
Due to yesterday’s stalling action in the averages, we have tightened up the stops in a few ETF positions. We are sticking with a loose stop in $TAN, as wee are only holding a 25% position and would like to see how the price action holds up at the 50-day MA over the next few weeks.

While we have tightened up the stops on a few positions, we remain bullish on crude oil, as the price action in the United States Oil Fund ($USO) has shown relative strength versus the S&P 500 as of late. The relative strength line in the bottom half of the chart below has broken out to new highs ahead of the price action, which is a bullish sign.

Please note the new $USO buy entry in the watchlist section above. Since the consolidation over the past few weeks has been pretty tight, we feel comfortable adding to the position over the two-day high in anticipation of a move to new highs within the next week or two.
Monday’s late selling action was a strong reminder to all that market conditions are still not healthy, which is why our timing model remains in neutral. If you are new to our newsletter, it is fine to have on a few long positions that recently triggered, but you probably do not want get much above 30-40 long exposure until conditions improve. However, it is possible to have more than 50% exposure if you are holding on to a winners from earlier buy points.
On the stock side, we sold $WDAY for a solid 13% gain when it triggered our tight stop. We do not have any new buy setups for today, but we are monitoring $EVR for a potential buy entry within the next few days. The monthly chart below shows the big breakout to new highs on heavy volume.

With $EVR moving to new highs, there is no overhead resistance to work through, so as soon as market conditions turn bullish, the stock could go on a nice run.
The weekly chart is in good shape, with the consolidation tightening up on lower than average volume. The current consolidation should at the very least hold the 10-week moving average (in blue) and hold above the highs of the last base, around $44.
