market timing model:
Buy – Signal generated on the close of December 18 (click here for more details)
today’s watchlist (potential trade entries):

Having trouble seeing the open positions graphic above? Click here to view it directly on your web browser instead.
open positions:
Below is an overview of all open positions, as well as a report on all positions that were closed only since the previous day’s newsletter. Net P/L figures are based on two separate $50,000 model portfolios (one for ETFs and one for stocks). Changes to open positions since the previous report are listed in pink shaded cells below. Be sure to read the Wagner Daily subscriber guide for important, automatic rules on trade entries and exits.
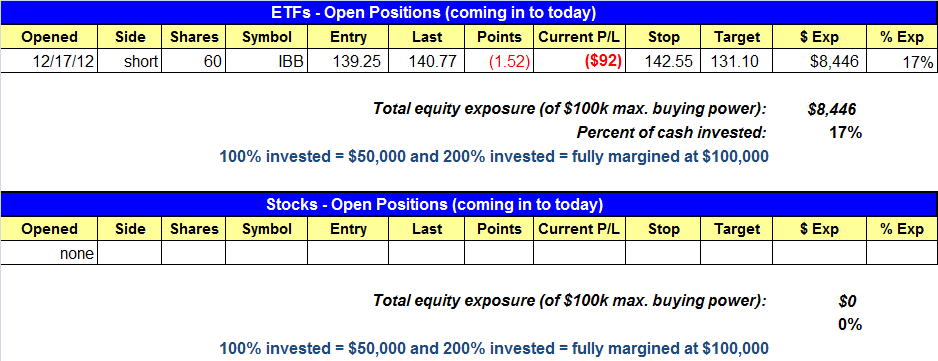
Having trouble seeing the open positions graphic above? Click here to view it directly on your web browser instead.
closed positions:
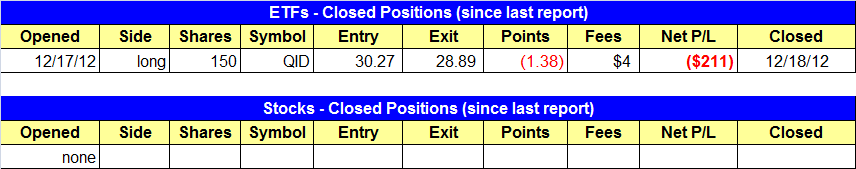
Having trouble seeing the closed positions graphic above? Click here to view it directly on your web browser instead.
- QID sell stop triggered and we are out.
- Please make sure to read the last three paragraphs of today’s ETF commentary.
stock position notes:
- No trades were made.
ETF and broad market commentary:
Rallying past resistance of their formerly troublesome 50-day moving averages, the main stock market indexes printed another substantial round of gains for the second straight day. Again leading the way, the Nasdaq Composite jumped 1.5%, the S&P 500 climbed 1.2%, and the Dow Jones Industrial Average advanced 0.9%. Most importantly, higher volume accompanied the broad-based gains, enabling both the S&P and Nasdaq to register a second consecutive “accumulation day.” Given that turnover in the week preceding Christmas is typically slow, the 20% increase in NYSE volume was impressive.
After a week long shakeout below the 50-day moving average in early December, the iShares Home Construction Index ($ITB) broke out and closed at new 52-week highs yesterday. The base started back in October, with $ITB stalling out just below 21.00 after a 20% move out from the prior base. The early December shakeout formed a necessary higher swing low on December 6, after a violent shakeout below the 50-day MA in mid-October. Although we missed the breakout we will continue to monitor the price action for a second breakout entry or a pullback entry on 3-5 days of weakness.

Energy Select SPDR Fund ($XLE) cleared a downtrend line and reclaimed its 50-day moving average on Tuesday. $XLE has put in a series of higher highs and higher lows over the past few weeks since holding support of the 200-day MA in late November. This is not an actionable trade, but it is always a positive sign for the market to see more participation in a rally.

Several days ago, we said the Nasdaq (and $QQQ in particular) may be poised to head back down in the near to intermediate-term. This assessment was based on objective technical analysis that showed several of the major indices forming a bearish “shooting star” candlestick patterns on their weekly charts, combined with the Nasdaq breaking below support of its 20, 50, and 200-day moving averages. However, technical analysis never guarantees a particular outcome (we would all be multi-billionaires if that was the case). Rather, the purpose of technical analysis is merely to give us a consistent, slight mathematical edge over the long-term. This means we will obviously have losing trades on a regular basis, just as we’ve had over the past 10 years. However, as long as the capital losses of the average losing trades are at least 1.5 to 2 times smaller than the average winning trades, we know our results will be consistently profitable over time (as shown here on our website).
Based on the above analysis from several days ago, we recently initiated a short position in the Nasdaq through buying an inversely correlated “short ETF” ($QID). Yesterday, this position hit our stop price just two days after entry, which means we were clearly wrong (and have no problem admitting so). But most importantly, our capital risk for this trade setup was controlled beforehand by pre-determining a reduced share size that limited our risk on the trade to just $200 (less than half our normal full risk on a swing trade). Therefore, although it may be disappointing that the trade didn’t work out, losing trades are simply part of the business, and is not something we are ever concerned about. This is because we simply move on to the next trade opportunity, while continuing to follow our proven swing trading strategy that has enabled us to consistently outperform the broad market since 2002.
Two days of accumulation in a row puts the timing model back on a buy signal. The volume levels have been impressive and the volume pattern itself is now quite bullish. Along with improving volume patterns, we have seen quality stocks breakout from bullish patterns the past few days. If new breakouts hold up and follow through, then it will provide more evidence that a new bull market is under way.
stock commentary:
Prior to Monday’s price and volume action, there was no clear reason to be actively trading on the long side which is why the timing model was at neutral, as most stocks were either putting in false breakouts or simply chopping around pivotal buy levels. However, after two days of heavy buying in the market, the timing model is back on a buy signal. The market is building momentum and there is enough evidence out there to begin buying stocks again.
We have three new buy setups today in $LCC, $REGN, and $MTZ. Position size is around 10% for these trades. The goal is to start of slow with 2-4 longs and see how they react. If they hold up well, then we can add more exposure by increasing the number of open positions and the position size.
If you are a new subscriber, please e-mail [email protected] with any questions regarding our trading strategy, money management, or how to make the most out of this report.
relative strength combo watchlist:
Our Relative Strength Combo Watchlist makes it easy for subscribers to import data into their own scanning software, such as Tradestation, Interactive Brokers, and TC2000. This list is comprised of the strongest stocks (technically and fundamentally) in the market over the past six to 12 months. The scan is updated every Sunday, and this week’s RS Combo Watchlist can be downloaded by logging in to the Members Area of our web site.