Current signal generated on close of June 20
Past signals:
- Buy signal on the close of June 13
- Neutral signal on close of June 12
- Buy signal on the close of April 30
today’s watchlist (potential trade entries):

Having trouble seeing the open positions graphic above? Click here to view it directly on your web browser instead.
open positions:
Below is an overview of all open positions, as well as a report on all positions that were closed only since the previous day’s newsletter. Net P/L figures are based a $100,000 model portfolio. Changes to open positions since the previous report are listed in pink shaded cells below. Be sure to read the Wagner Daily subscriber guide for important, automatic rules on trade entries and exits.

Having trouble seeing the open positions graphic above? Click here to view it directly on your web browser instead.
closed positions:

Having trouble seeing the closed positions graphic above? Click here to view it directly on your web browser instead.
ETF position notes:
- $SMH stop triggered.
stock position notes:
- No setups triggered.
ETF, stock, and broad market commentary:
After undercutting the prior day’s low, stocks rebounded in the afternoon and closed well off the lows of the session. It was a decent reversal day for most averages, confirmed by a pick up in volume on the S&P 500 and NASDAQ Composite. However, the ugly selling action during the week produced the first break of the 10-week MA in the S&P 500 since last December. Along with the S&P 500, the NASDAQ Composite, NASDAQ 100, Dow Jones, and S&P 400 all closed well below the 10-week MA. While the small cap Russell 2000 closed below the 10-week MA, it was not as convincing of a break down.
During a corrective phase in a bull market, price action should find support at the highs of the last valid base (resistance turns in to support). All major averages are pulling back in to the highs of the last base. On the weekly charts below, current price action is pulling back in to support of the highs of the last base, which is the purple horizontal line. We view support as more of an area rather than just one line, so as long as the price action holds at or around this level it is bullish.
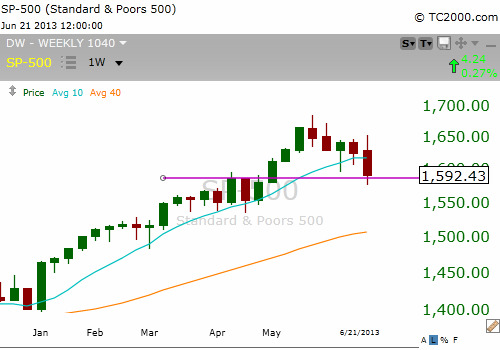
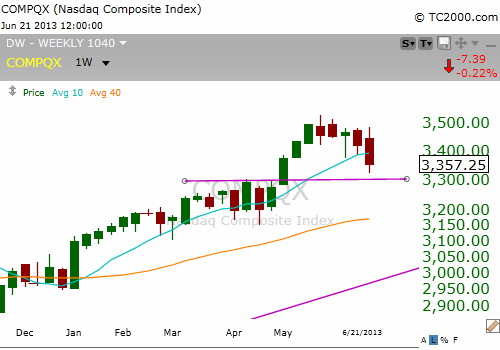
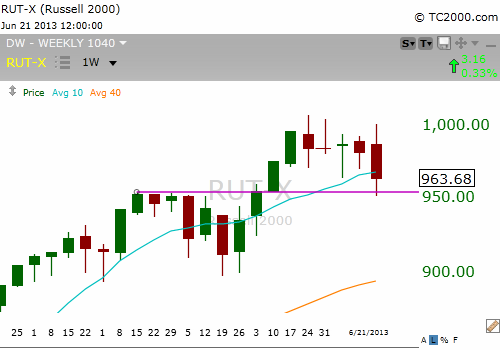
Due to the bearish volume pattern in the NASDAQ and S&P 500, we must once again wait for a bullish follow through day to produce a buy signal. Before a follow through day can take place, the major averages must hold on to Friday’s low for three more days, so Thursday would be the first day that a follow through day could produce a legit buy signal.
Although our timing model is in neutral, we can take partial size in stocks/ETFs that are showing relative strength vs. the broad market averages. The key to this is to not get carried away with the buying and keep size small until conditions begin to improve. While in neutral mode we should not have more than 25-35% exposure in new names (this should not include names that we are already in that have held up).
Here are a few non-inverted ETFs that have held up the best and are still trading above the 10-week MA: $KBE (Banking), $IAI (Broker-Dealer), $TAN (Solar), and $IHI (Medical). Of these four, $KBE is the only ETF yet to break the lows of its recent base the past two weeks, which is impressive. Financials remain strong.
On the stock side, we definitely see a mix of stocks breaking support along with stocks holding up well. Some big cap NASDAQ stocks remain in good shape ($GOOG, $PCLN, and $AMAZN). Many IPOs from 2011-2013 have shown great relative strength the past two weeks. $ANGI, $AWAY, $SPLK, $REGI, $XONE, $SLCA, $Z, $RPXC, $DNKN, $KKD, $YELP, $CHUY, $BLMN, $PRLB, $AMBA, and $SEAS have all held up well.
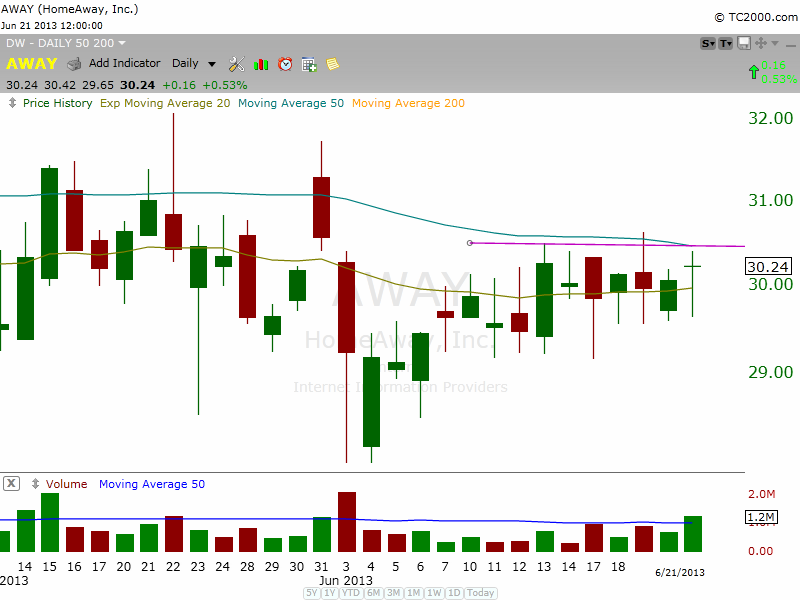
The weekly chart of recent IPO $AWAY still looks pretty bullish, with tight price action the past two weeks. A break of the weekly downtrend line could produce some buying interest.
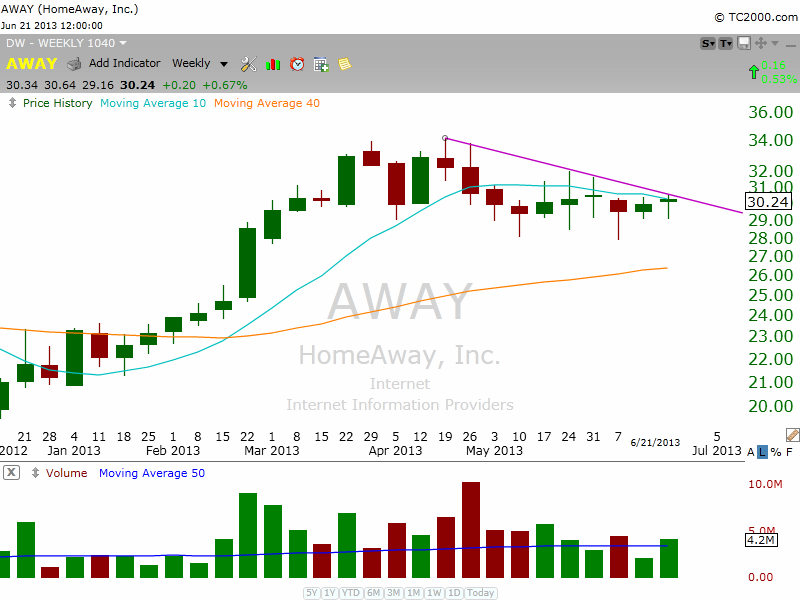
For those who exited $AWAY on Friday, there is a clear entry point 12 cents over last week’s high at 30.76 (use the stop we already have in place). If $AWAY can climb above the weekly downtrend line while the market bounces, we could potentially see a decent move. Because we are swing traders looking for 15-30% moves over 2-8 weeks, we are not concerned with getting out and re-entering a position slightly higher.
Other potential re-entry points on open positions are:
- $LLEN can be re-entered above the two-day high at 4.06, which is over the hourly downtrend line.
- $KORS can be bought on the open, provided that the open is above 58.75. If the open is below 58.75 then wait for a move back above the 50-day MA to initiate position using the same stop we have in the open positions section.
We are selling $AMBA at market on Monday’s open to lock in gains, as we expect some choppy price action over the next week or two. We will look to re-enter if the price action can hold above the 20-day EMA if/when market conditions improve.