market timing model: Buy
Current signal generated on close of September 9.We are no longer in confirmed buy mode, but remain in buy mode (which is holding on by a thread). Portfolio exposure depends on how well positions have held up, but anywhere from 50% to 100% (if positions are in good shape) is okay.
Past signals:
- Neutral signal generated on close of August 15
- Buy signal generated on close of July 11
- Neutral signal generated on close of July 5
- Sell signal generated on close of June 24
today’s watchlist (potential trade entries):

Having trouble seeing the open positions graphic above? Click here to view it directly on your web browser instead.
open positions:
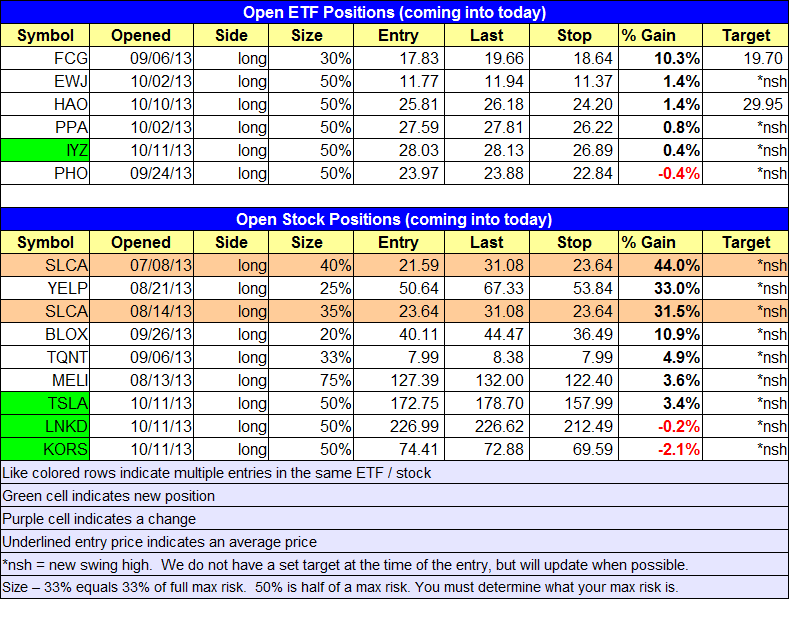
Below is an overview of all open positions, as well as a report on all positions that were closed only since the previous day’s newsletter. Changes to open positions since the previous report are listed in pink shaded cells below. Be sure to read the Wagner Daily subscriber guide for important, automatic rules on trade entries and exits. Click here to learn the best way to calculate your share size.
Having trouble seeing the open positions graphic above? Click here to view it directly on your web browser instead.
closed positions:

Having trouble seeing the closed positions graphic above? Click here to view it directly on your web browser instead.
ETF position notes:
- Bought $IYZ.
stock position notes:
- Bought $LNKD, $TSLA, and $KORS on the open.
ETF, stock, and broad market commentary:
Stocks followed through on Thursday’s clutch reversal action with another day of solid gains, especially in the $Russell 2000, which closed up nearly 1.4%. The S&P 500 rallied 3.5% off the lows of the week to close well above the 50-day moving average, and as of last Friday’s close, all major averages have reclaimed the 50-day MA.
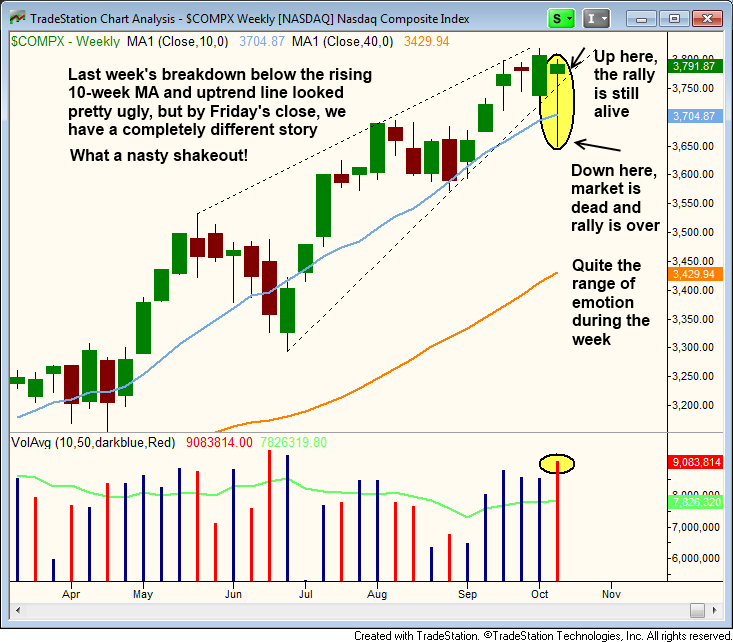
Turnover was lighter once again, so technically the S&P 500 or NASDAQ has yet to produce an accumulation day. However, we noticed plenty of bullish reversal candles on the weekly charts of leading stocks and major averages. The weekly chart of the NASDAQ Composite below shows the bullish reversal action after an undercut of the uptrend line and 10-week MA. Thursday’s gap up was very strong, and probably left a ton of traders in the dust after getting stopped out earlier in the week.
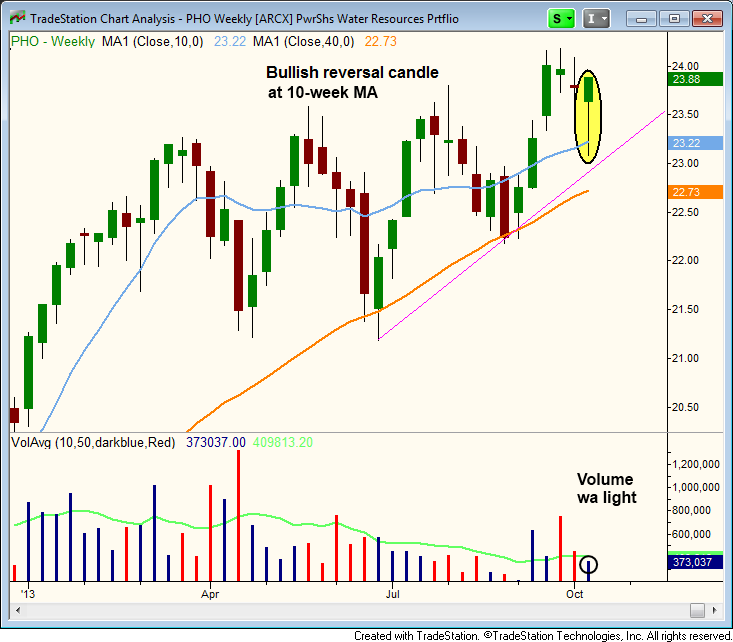
Along with NASDAQ Composite, we saw bullish reversal action in Powershares Water Resource Portfolio ($PHO) as it bounced off the 10-week MA and closed near the highs of the week. We continue to hold $PHO in our ETF portfolio after a breakout buy late last month. If the $23 support level can hold, then we should eventually see a breakout to new 52-week highs.
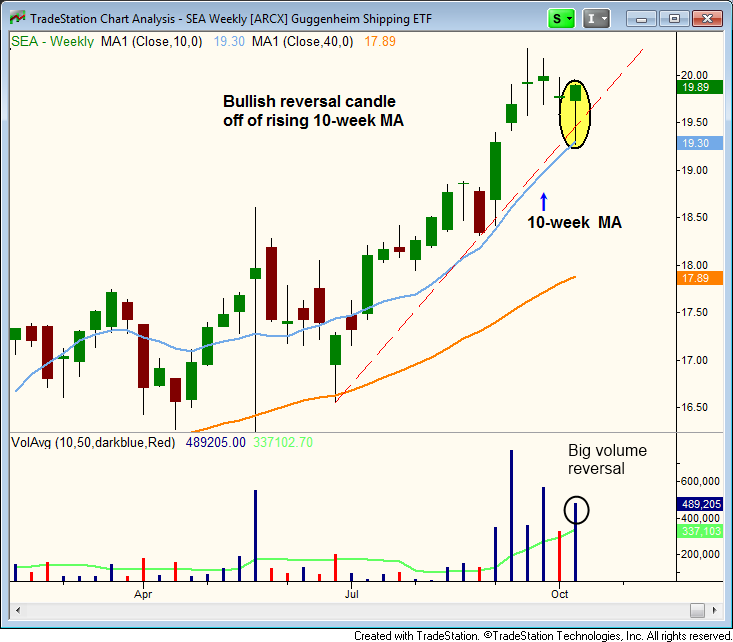
After recently breaking out from a long term base at $19, the Guggenheim Shipping ETF ($SEA) pulled back to support of the rising 10-week MA and held, forming a bullish reversal candle on the weekly chart below. The 10-week MA is usually the first big support level for a stock/ETF that has lost steam after a big breakout, and has pulled back in for a few weeks. In a strong uptrend, ETFs or stocks will often find support at the 10-week MA three to five times during an extended run, so these levels are typically low risk entry points. Although we are not placing $SEA on today’s official watchlist, it is a potential buy over last week’s high plus a few cents to avoid a false trigger.
We added one new position to the ETF portfolio on Friday in $IYZ, which broke the downtrend line of the consolidation and closed out the week strong. On the stock side, we bought $KORS, $TSLA, and $LNKD at the market on Friday’s open. We believe these stocks along with $YELP, $QIHU, $BLOX and a few others are the top names in the market. With all three entries on Friday, we are basically looking for last week’s low to hold. If these lows hold, then our positions and the market should be in great shape.
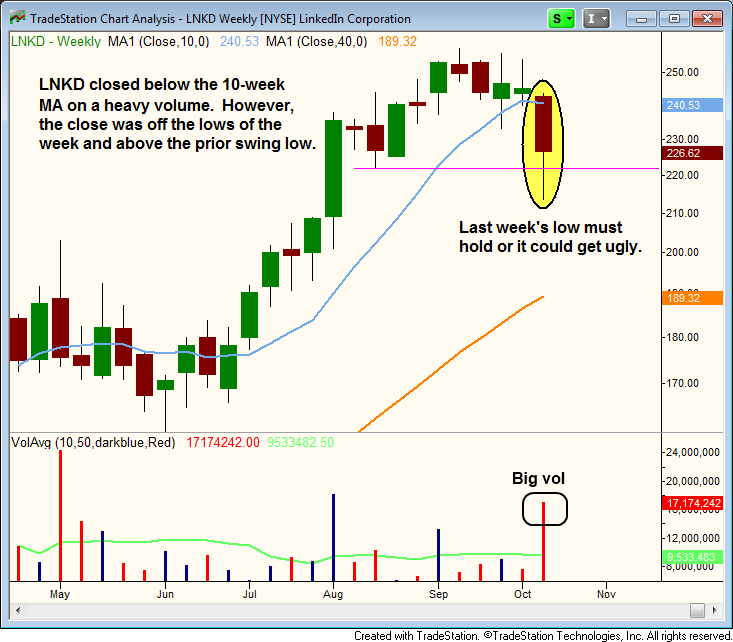
$LNKD broke down last week on heavy volume and closed below the 10-week MA, but thanks to the late reversal action, the close was well off the lows of the week.
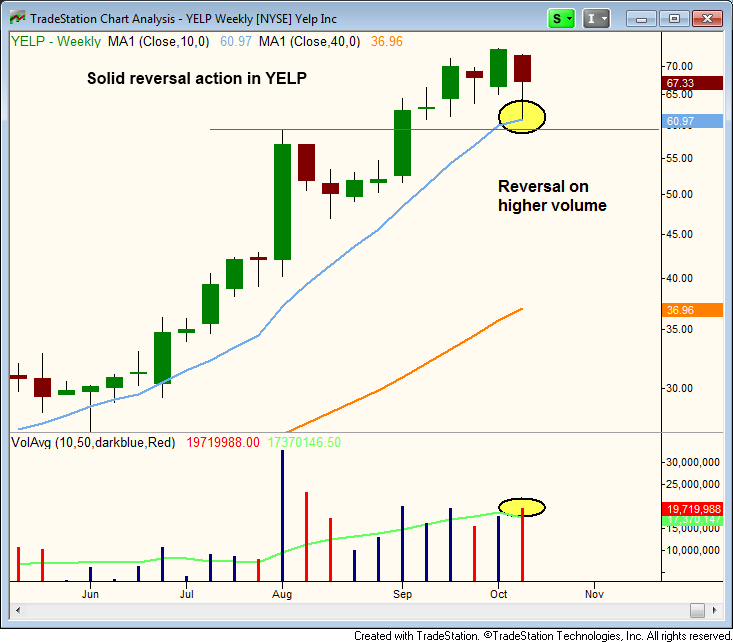
$TSLA and $KORS are in better shape, and so is $YELP, which found support at the rising 10-week MA and closed with a bullish reversal bar after undercutting the lows of the past three weeks.
Since $TSLA, $KORS, and $LNKD, are A rated stocks, we are looking at a two to three month or more holding period, as long as market conditions remain healthy. If these stocks can breakout to new highs and run 20% or more in a just few weeks, then that will be a clear sign to hold for a potential bigger advance.