market timing model: (Confirmed) Buy
Current signal generated on close of September 9.We are now in confirmed buy mode, so portfolio exposure can be more than 100% if you have a marginable account. However, please make sure that current long positions in your portfolio are working before adding new ones. Portfolio exposure should be at least 75% to 100% (or more) right now.
Past signals:
- Neutral signal generated on close of August 15
- Buy signal generated on close of July 11
- Neutral signal generated on close of July 5
- Sell signal generated on close of June 24
today’s watchlist (potential trade entries):

Having trouble seeing the open positions graphic above? Click here to view it directly on your web browser instead.
open positions:
Below is an overview of all open positions, as well as a report on all positions that were closed only since the previous day’s newsletter. Changes to open positions since the previous report are listed in pink shaded cells below. Be sure to read the Wagner Daily subscriber guide for important, automatic rules on trade entries and exits. Click here to learn the best way to calculate your share size.

Having trouble seeing the open positions graphic above? Click here to view it directly on your web browser instead.
closed positions:
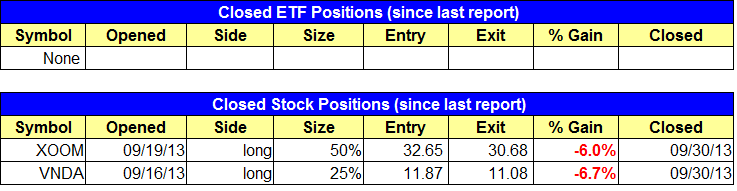
Having trouble seeing the closed positions graphic above? Click here to view it directly on your web browser instead.
ETF position notes:
- Selling $TAN at market on Tuesday’s open.
stock position notes:
- Note that we lowered the stop price in $YELP to allow some wiggle room on a pullback to the 20-day EMA.
ETF, stock, and broad market commentary:
Due to concerns over a potential government shutdown, stocks opened significantly lower across the board. However, the selling was limited to the open in the NASDAQ and Russell 2000, as both averages powered higher the rest of the day before selling off into the close and finishing with minor losses. At one point during the afternoon, both the Russell and NASDAQ managed to turn green, which was impressive considering the weak open.
Once again, the S&P 500 and Dow Jones underperformed. The Dow is now clearly below the 50-day MA, which is our technical line in the sand for a bull market, but the S&P 500 did manage to close above the 50-day MA.
After touching the top of a weekly channel last month, the S&P 500 has pulled back to the 10-week MA, which is just above the bottom trendline of the channel. This area should prove to be a decent support level for buyers to step in.

Turnover increased on both exchanges, so the NASDAQ and S&P 500 by definition suffered a distribution day. That being said, we find it tough to label the NASDAQ a distribution day when it prints a bullish reversal candle on higher volume. The S&P 500 suffered a distribution day with a -0.6% loss and a close near the middle of the day’s range, but at least the close was not at the dead lows of the session.
Our long position in $TAN outperformed heavily once again on Monday. We plan to sell our full long position at the market on Tuesday’s open to lock in a +40% move into strength.
The Russell 2000 and NASDAQ both printed bullish reversal candles. A move above the high of these candles could lead to a breakout to new 52-week highs in short order. If the reversal candle lows are violated within the next few days, then we could potentially see a few more weeks of backing and filling.


We are placing Direxion Daily Small Cap Bull 3X ETF ($TNA) on today’s official buy watchlist due to yesterday’s bullish reversal action in $IWM. If the uptrend in the Russell 2000 resumes, then we could see a strong muti-week advance, so a long position in $TNA would be ideal to take advantage of such a move. $TNA is not suited for buy and hold investing, but that is something that we have never done. Trade details can be found in the watchlist section above.

We stopped out of $VNDA and $XOOM yesterday. $XOOM closed with a bullish reversal candle, so we are placing it on today’s watchlist as an official buy. For many traders, re-entering a trade right after it stops out is tough to do. The reality is, no trader is perfect, and sometimes we get in too early and get stopped out. If the setup remains intact, and a new buy entry emerges, then we MUST get back in. If $XOOM closed at the dead lows of the day, then we would have no reason to re-enter. But if formed a bullish reversal candle, so getting back in over Monday’s high is a low risk entry point and one that we can not pass up. We are not forcing the action, we are simply following our system.
The price and volume action in $XOOM has been impressive over the past two months. We like the cup and handle pattern that has formed on the weekly chart. We specifically like the big volume on the move back above the rising 10-week MA during the week of 9/9 to 9/13.

The daily chart shows Monday’s bullish reversal candle off the 50-day MA. The handle has pulled back about 13% off the recent swing high, which has more than likely washed out a bunch of longs (including us). The re-entry is over Monday’s high with a stop beneath the same day’s low. We are looking for a move to new highs.
