Buy
– Signal generated on the close of April 30
Due to the recent distribution in the Nasdaq, we are no longer in confirmed buy mode (now is not the time to step on the gas). We remain in buy mode, but if market conditions continue to deteriorate the timing model will shift to sell mode.
today’s watchlist (potential trade entries):

Having trouble seeing the open positions graphic above? Click here to view it directly on your web browser instead.
open positions:
Below is an overview of all open positions, as well as a report on all positions that were closed only since the previous day’s newsletter. Net P/L figures are based a $100,000 model portfolio. Changes to open positions since the previous report are listed in pink shaded cells below. Be sure to read the Wagner Daily subscriber guide for important, automatic rules on trade entries and exits.

Having trouble seeing the open positions graphic above? Click here to view it directly on your web browser instead.
closed positions:
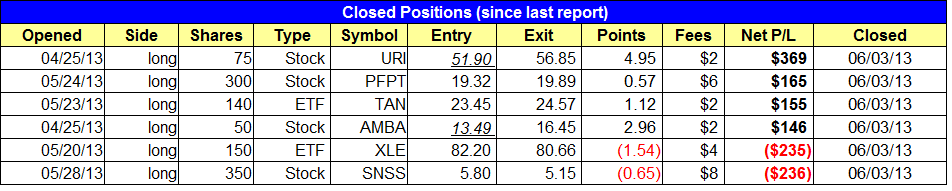
Having trouble seeing the closed positions graphic above? Click here to view it directly on your web browser instead.
ETF position notes:
- Sold $TAN and $XLE.
stock position notes:
- Sold partial size in $AMBA, and sold rest of SNSS and all of $URI for a $350 gain.
ETF, stock, and broad market commentary:
Stocks appeared to be following through on last Friday’s weakness with most averages down 1.0% or more by 11:30 am. However, stocks found traction during the lunchtime doldrums and surged higher in the final hour of trading, sending most averages into positive territory by the close (the S&P Midcap 400 was the lone holdout). The afternoon reversal was impressive, as the Nasdaq climbed almost 1.5% off the lows of the day by the close.
Volume confirmed yesterday’s price action, as turnover increased on both exchanges. NYSE volume was less than 1% higher, but Nasdaq volume increased by 6%. The positive close on higher volume produced a much needed accumulation day for both the Nasdaq and S&P 500.
After undercutting Friday’s low and the 20-day EMA, S&P 500 ETF ($SPY) rallied to close above the 20-day EMA and the prior swing low on May 23.

Small cap stocks continue to show relative strength, as $IWM has yet to close below the 20-day EMA or break the prior swing low from May 23.

Financials continue to act well, and that is a bullish sign for the market. The weekly chart of Financial Select Sector SPDR ($XLF) is consolidating in a tight range at the highs the past few weeks, well above the rising 10-week MA. The financials have been in good shape all year, breaking out from two bullish basing patterns (one in January, the other in May).

Confirming the strength in $XLF is the recent breakout in the iShares Dow Jones US Broker-Dealers ($IAI).

Look for $IAI to sit in a tight range above $29. The rising 10-week MA is the line in the sand for the setup to remain bullish.
United States Natural Gas Fund ($UNG) is still holding above the prior swing low on the weekly chart below. $UNG must break the downtrend line of the current consolidation before the uptrend can resume.

$UNG is attempting to reverse and ugly four year downtrend, as evidenced by the recent bullish crossover on the weekly chart. The 10-week MA crossed back above the 40-week MA in March.
We sold both $XLE and $TAN yesterday, but will look to re-enter if a low risk buy point emerges later this week or next week.
On the stock side, we sold 50 shares of $AMBA and now have 150 shares remaining that we will hold through earnings (reports June 4 after the close). $PFPT triggered our tight stop and we are out with a small gain. We sold $URI on the open, locking in a $350 gain. We will look to re-enter $URI if it continues to consolidate in a tight range. The second half of $SNSS triggered its stop yesterday and we are out.
We have one new setup on today’s watchlist in $KORS, which we plan to buy at market on the open. The entry is basically a pullback entry to the breakout pivot. If the breakout is legit, then $KORS should hold above the 20-day EMA until the uptrend resumes. We have a loose stop in right now, but we will tighten up the stop if the price action closes below
