market timing model:
Selll – Signal generated on the close of October 12 (click here for more details)
today’s watchlist (potential trade entries):
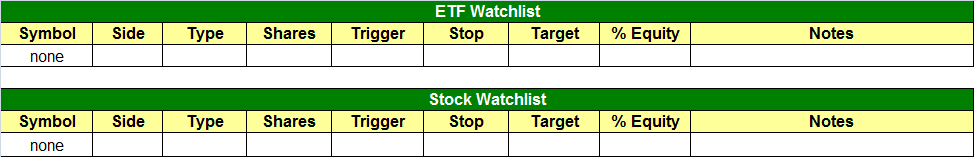
Having trouble seeing the open positions graphic above? Click here to view it directly on your web browser instead.
open positions:
Below is an overview of all open positions, as well as a report on all positions that were closed only since the previous day’s newsletter. Net P/L figures are based on two separate $50,000 model portfolios (one for ETFs and one for stocks). Changes to open positions since the previous report are listed in pink shaded cells below. Be sure to read the Wagner Daily subscriber guide for important, automatic rules on trade entries and exits.

Having trouble seeing the open positions graphic above? Click here to view it directly on your web browser instead.
closed positions:
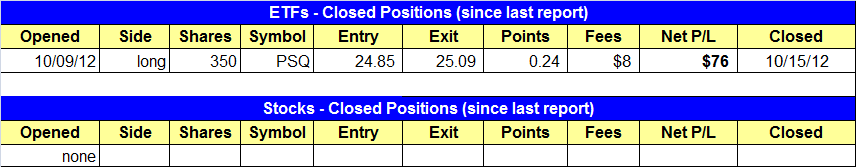
Having trouble seeing the closed positions graphic above? Click here to view it directly on your web browser instead.
ETF position notes:
- PSQ stopped us out for a small scratch gain.
stock position notes:
- No trades were made.
ETF and broad market commentary:
Stocks gapped higher on the open but immediately sold off, sending the major averages about 0.5% lower during the first ninety minutes of trading. However, unlike the past several sessions, buyers finally stepped in during the lunchtime doldrums and once again in the final hour of trading to push indices to new intraday highs at the close. All broad based averages closed with a gain in the 0.6% to 0.8% range, with the S&P 500 ($SPX)and S&P Micap 400 ($MID) showing the most impulsive price action intraday. The Nasdaq Composite was a laggard in terms of price action intraday, as it only managed to extended past the morning high in the last fifteen minutes of trading. The positive close snapped a six session losing streak in the Nasdaq Composite.
Turnover increased on both exchanges, which is good news for a market that prior to today had not seen an accumulation day in two weeks. Total volume in the NYSE was 9% higher than the previous day’s level, while volume surged by 2% in the Nasdaq. In both the NYSE and Nasdaq, advancing volume beat declining volume by a decent 2.5 to 1 margin. Monday’s price and volume action was a step in the right direction, but the market still has plenty of work to do to establish an intermediate-term bottom.
After a strong run up off the summer lows, CurrencyShares Euro ($FXE) is now consolidating in a tight range above the 200-day moving average. $FXE should continue to set higher swing lows within the base, which would be a bullish sign. In terms of moving average confirmation, although we would prefer to see the 50-day MA above the 200-day MA, the 50-day MA is sloping higher over the past month. We will continue to monitor the action over the next few days for low risk entry point.

We remain long the First Trust ISE Revere Natural Gas ETF ($FXG) from a pullback buy entry on September 27. The price action has been trading in a tight range the past few weeks and has shown relative strength by setting higher swing lows while the market sold off. Monday’s bullish reversal candle on higher volume may have scared off some of the weak longs. A move above Monday’s high could spark the next breakout attempt above the current range high.

Although we do not have a position in the United States Oil Fund ETF ($USO), we continue to monitor the price action along with stocks such as $AAPL and other indicators to gauge the health of the current market rally. If $USO suffers further technical damage and is unable to hold the 32.50 swing low, then a test of the June lows may be in order. A breakdown in $USO could signal that the market may see further weakness before an intermediate-term bottom is in. Again, this is just one of many tools in our arsenal to help confirm broad market price action. It is not a stand alone indicator.

We look for Monday’s bullish reversal candle action to lead to a short-term bounce in the major averages. It is much too early to talk about the market setting an intermediate-term bottom here, as there simply isn’t enough evidence to support such a claim. For the market to put in an intermediate-term bottom we would first like to see one or more averages stop setting new swing lows for at least a week. We’d also need to see a bullish volume pattern emerge, with little to no distribution days over the next few weeks.
stock commentary:
Potential stocks to purchase with small size for aggressive traders only. Keep share size light (maybe 1/3 of full). If taking bigger size look to reduce position into strength after a strong 1-3 day bounce and hold rest (or sell all if market has no accumulation). The setups below ARE NOT OFFICIAL. If you take these trades you accept that you will be operating against the market timing model.
- NTE – 10.47 & 10.65 buy points, stop beneath low of day on date of entry (reports earnings Nov. 5)
- KORS – 54.05 buy point, stop low of day on date of entry or 52.49 (earnings Nov. 13)
- VRX – 56.80 buy point, stop 54.99 (earnings Oct. 31)
As mentioned above, we are now waiting for the market to settle down and for volume patterns to turn bullish. Whether this takes five days or three weeks we do not know.
If you are a new subscriber, please e-mail [email protected] with any questions regarding our trading strategy, money management, or how to make the most out of this report.
relative strength combo watchlist:
Our Relative Strength Combo Watchlist makes it easy for subscribers to import data into their own scanning software, such as Tradestation, Interactive Brokers, and TC2000. This list is comprised of the strongest stocks (technically and fundamentally) in the market over the past six to 12 months. The scan is updated every Sunday, and this week’s RS Combo Watchlist can be downloaded by logging in to the Members Area of our web site.