market timing model: BUY
Current signal generated on close of November 13.
Portfolio exposure can be anywhere from 75 to 100% long. If positions are holding up well, then one can add exposure beyond 100% (for experienced traders only).
Past signals:
- Neutral signal generated on close of November 6.
- Buy signal generated on close of September 9
- Neutral signal generated on close of August 15
- Buy signal generated on close of July 11
- Neutral signal generated on close of July 5
- Sell signal generated on close of June 24
today’s watchlist (potential trade entries):

Having trouble seeing the open positions graphic above? Click here to view it directly on your web browser instead.
open positions:
Below is an overview of all open positions, as well as a report on all positions that were closed only since the previous day’s newsletter. Changes to open positions since the previous report are listed in pink shaded cells below. Be sure to read the Wagner Daily subscriber guide for important, automatic rules on trade entries and exits.

Having trouble seeing the open positions graphic above? Click here to view it directly on your web browser instead.
closed positions:
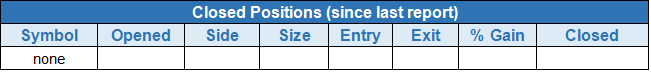
Having trouble seeing the closed positions graphic above? Click here to view it directly on your web browser instead.
ETF position notes:
- Note that we are either buying $PKB on a buy stop (entry A) or on a buy limit (entry B). Whichever setup triggers first is the one we will go with. The other setup is to be canceled.
stock position notes:
- $QUNR triggered on the open and $WUBA buy entry triggered over the 5-minute high + 10 cents.
ETF, stock, and broad market commentary:
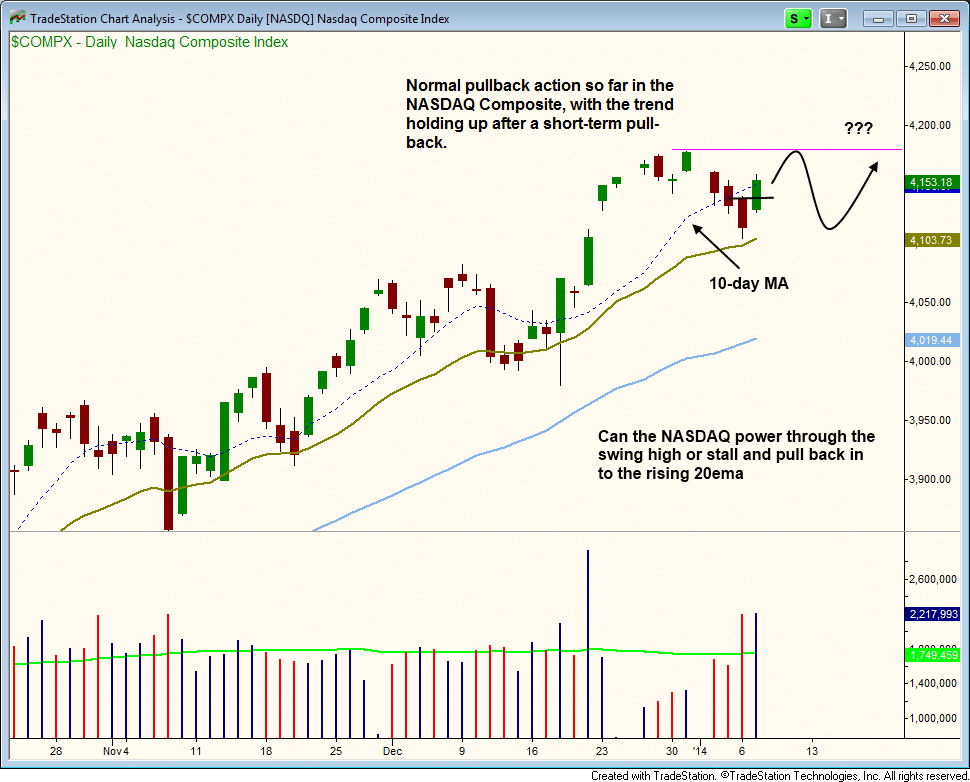
Led by the strength in the NASDAQ Composite, stocks rallied higher across the board on a pick up in volume. The strong turnover produced accumulation days in the NASDAQ Composite and S&P 500, which was a good sign after a few days of selling action on higher volume.
Yesterday’s rally put the S&P 500 and NASDAQ back above the rising 10-day MA. The daily chart of the NASDAQ shows typical pullback action. The next question is do we move out to new highs or stall at the prior high and consolidate a bit more?
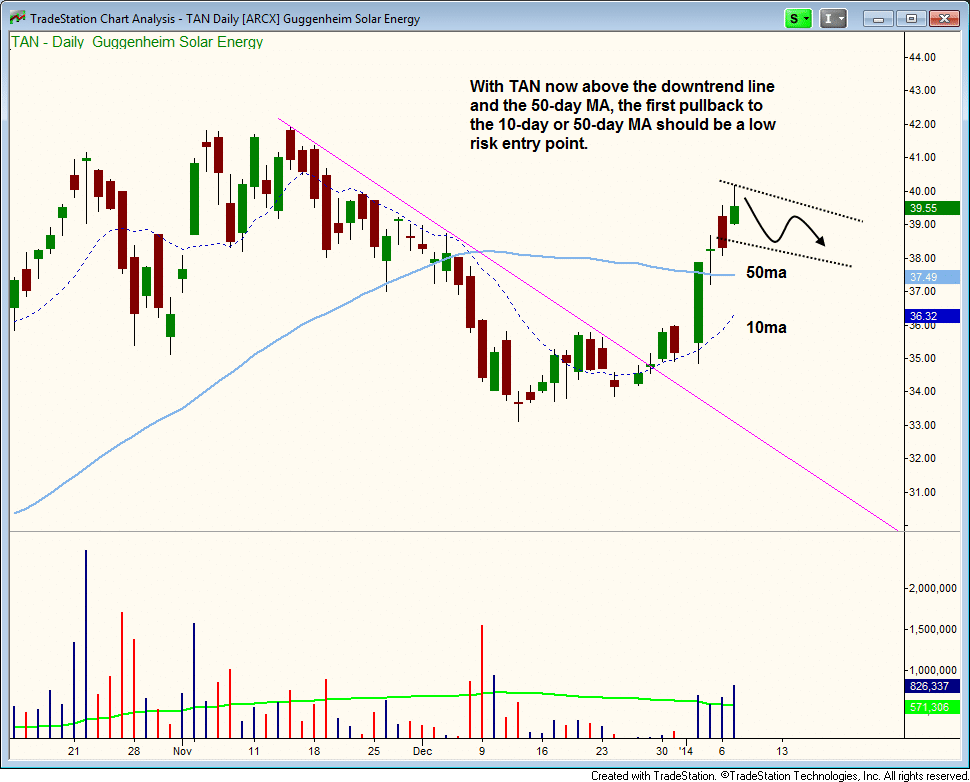
After clearing the downtrend line and the 50-day MA on a pick up in volume, we’d like to see Guggenheim Solar ETF ($TAN) pull back in over the next five to ten days. Best case scenario is a pullback to or just above the 50-day MA, which would present us with a very low risk entry point. However, $TAN may simply correct more by time (sideways) than price. If so, then the first pullback to the rising 10-day MA is the entry.
Currently $TAN is not actionable, so all we can do is patiently wait for a buy setup to develop.
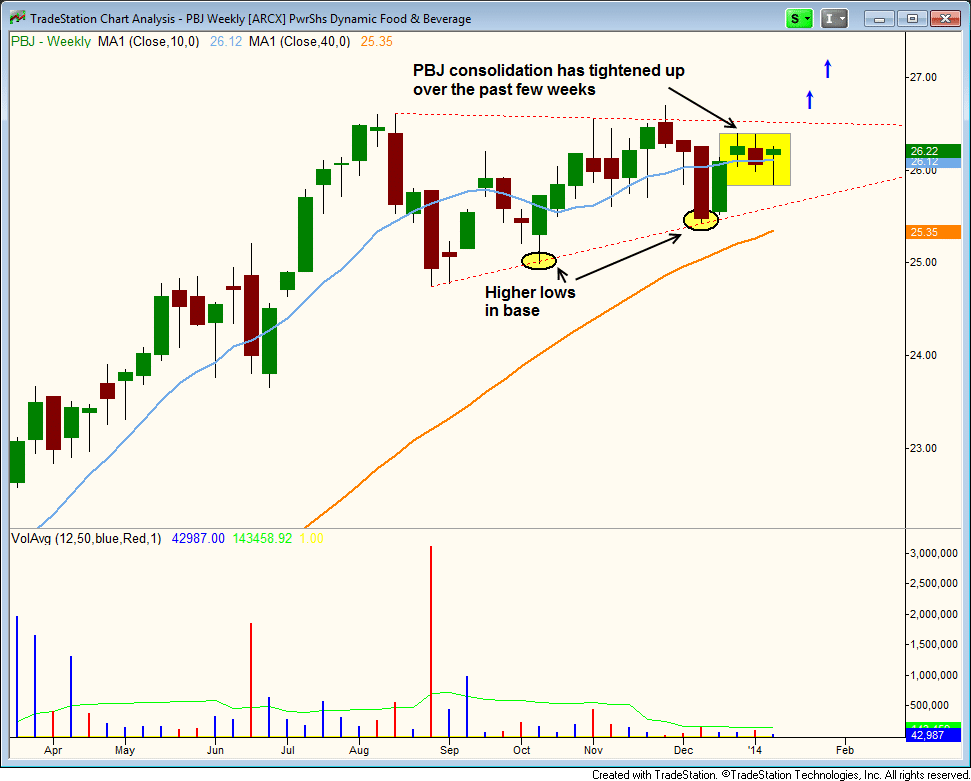
The PowerShares Dynamic Food & Beverage ETF ($PBJ) has formed a bullish consolidation just below the all-time high during the past five months. The 40-week MA remains in a clear uptrend and the 10-week MA has been trending higher as well through much of the base.
Notice how the price action has tightened up the past few weeks, just above the 10-week MA and the highs of the consolidation. This contraction in volatility is what we look for in a base, as it will often lead to a breakout.
We are placing $PBJ on today’s watchlist. Trade details can be found above.
On the stock side both $QUNR and $WUBA triggered yesterday and followed through. We have two new setups on today’s watchlist.
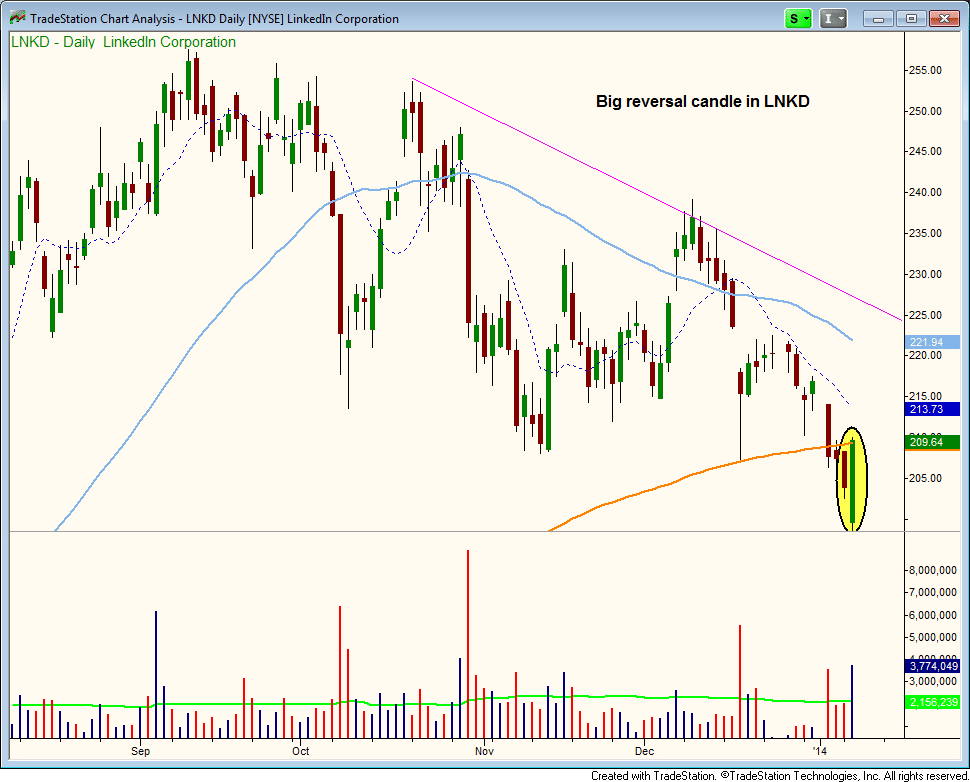
The first setup is in $LNKD, which put in a nice reversal candle yesterday after undercutting the 200-day MA. We are going with a small position on a slight pullback to the 20-period EMA on the hourly chart, expecting the low of yesterday’s candle to hold.
The share size should be small here, as we want to slowly build up our exposure as higher lows are set on the daily chart.
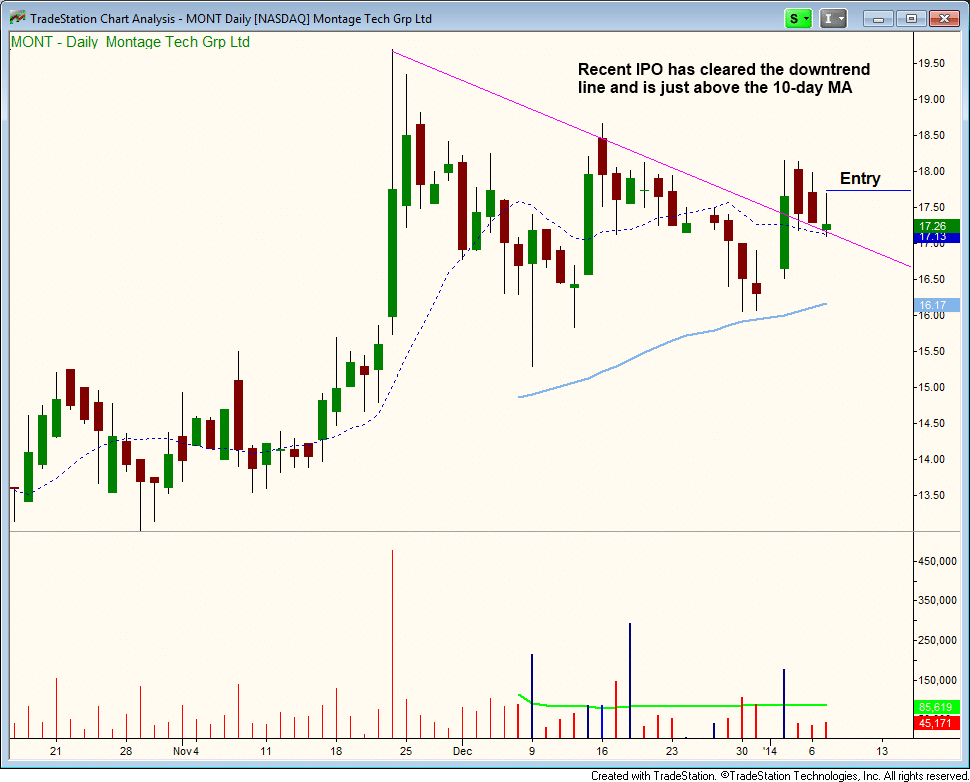
$MONT is a recent IPO that exploded higher in late November on big volume and has since pulled back to the 50-day MA with a higher low in place. The price action cleared the daily downtrend line last week on a pick up in volume and has since pulled back on lighter volume to the 10-day MA (and the same downtrend line).
Because $MONT does not trade much volume (we usually don’t dip below the 100k avg), we are taking very small share size. The idea here is that IPOs can be pretty explosive, so we want to have some exposure even if it is small size. $MONT, like $WUBA and $QUNR are trades we take for a quick pop to generate cash while we hold on to the the longer-term A rated setups like $MDCO, $FB, and $SCTY for a few months. If your portfolio is full, then you can simply pass on the setup.
We are looking for an entry over Tuesday’s high, with a pretty tight stop below Tuesday’s low minus some wiggle room. This setup should go right away.