market timing model:
Neutral – Signal generated on the close of August 2 (click here for more details)
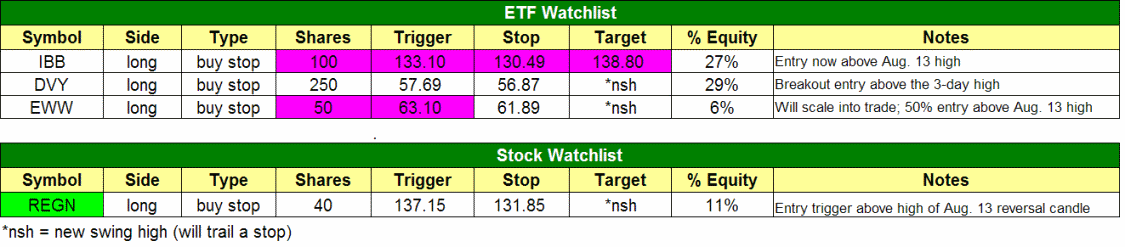
today’s watchlist (potential trade entries):
Having trouble seeing the open positions graphic above? Click here to view it directly on your web browser instead.
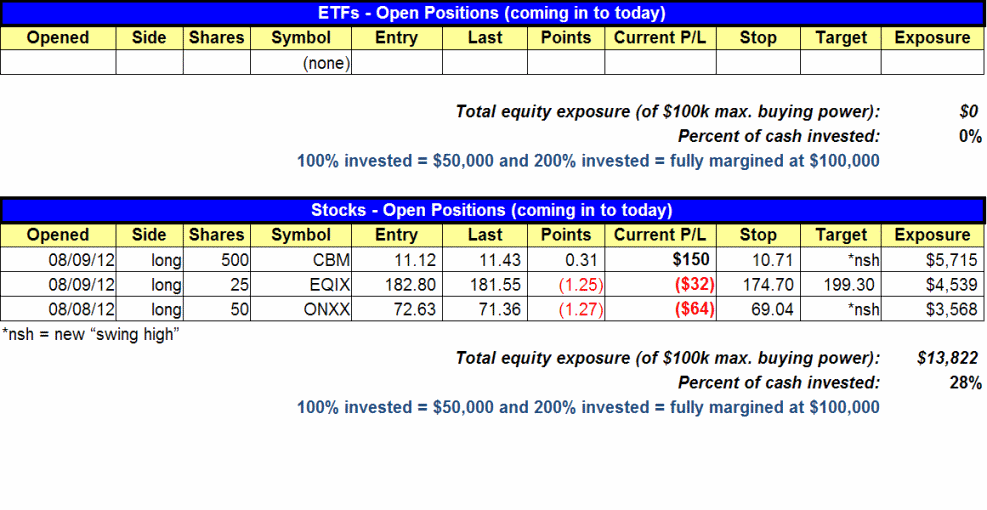
open positions:
Below is an overview of all open positions, as well as a report on all positions that were closed only since the previous day’s newsletter. Net P/L figures are based on two separate $50,000 model portfolios (one for ETFs and one for stocks). Changes to open positions since the previous report are listed in pink shaded cells below. Be sure to read the Wagner Daily subscriber guide for important, automatic rules on trade entries and exits.
Having trouble seeing the open positions graphic above? Click here to view it directly on your web browser instead.
closed positions:
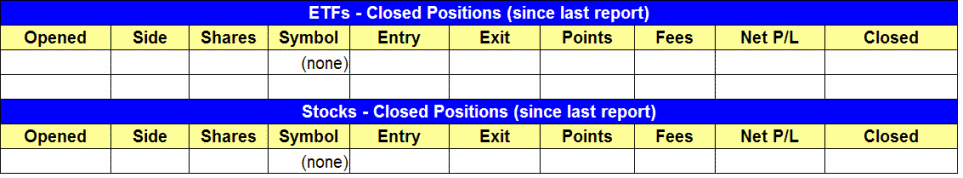
Having trouble seeing the closed positions graphic above? Click here to view it directly on your web browser instead.
ETF position notes:
- None of the three ETFs on yesterday’s watchlist ($IBB, $EWW, $DVY) triggered for buy entry. However, all three setups remain on today’s watchlist (note the adjusted trade parameters highlighted by cells shaded in pink). If we see decent follow-through on yesterday’s bullish reversal day, some of these setups will probably trigger for buy entry today.
stock position notes:
- $CBM made a nice move yesterday, rallying to close at a fresh multi-year high (see chart under “stock commentary” below). $EQIX and $ONXX both formed bullish reversal candles yesterday. No changes to the stop prices on any of these positions.
ETF and broad market commentary:
After opening near the flat line and trending lower throughout the first two hours of trading, the major indices initially surrendered all of last Friday’s late day strength and had fallen to near the lows of their current consolidation patterns. However, for the second day in a row, the bulls took advantage of buying early weakness to spark a late-day recovery. All the main stock market indexes formed bullish reversal candles and finished at their intraday highs. Still, only the Nasdaq Composite closed in positive territory, eking out a 0.1% gain. The S&P 500 edged 0.1% lower, the S&P MidCap 400 lost 0.2%, and both the Dow Jones Industrial Average and small-cap Russell 2000 indexes declined 0.3% yesterday.
Volume across the board declined for the fourth consecutive day. In both the NYSE and Nasdaq, turnover was 14% lower than the previous day’s levels. In the Nasdaq, it has been eight trading days since volume even registered above its 50-day average level (welcome to the summer doldrums). Declining volume exceeded advancing volume in both exchanges, but not by an overly poor margin. In the NYSE and Nasdaq, the ADV/DEC volume ratio was negative by 2 to 1 and 3 to 2 respectively. Although stocks showed late-day strength to settle near their intraday highs, the decreasing volume in both of those sessions indicated a lack of participation among banks, mutual funds, hedge funds and other institutions. Since institutional trading activity constitutes more than half of the market’s average daily volume, rally attempts are likely to be short-lived until we see institutions stepping back into the buy side. The importance of institutional trading activity is the reason why we discuss the market’s volume patterns every day.
Since August 9, the iShares Nasdaq Biotechnology Index Fund ETF ($IBB) has been on our watchlist as a potential pullback trade entry. Though it has not yet traded through our trigger price, it formed a bullish hammer candlestick pattern yesterday, which could lead to upside follow-through in today’s session. Further, it “undercut” (briefly dipped below) near-term support of its 20-day exponential moving average, as well as the low of its six-day trading range. This is illustrated on the daily chart pattern of IBB below:
")
When an ETF “undercuts” a key moving average, as IBB did yesterday, this serves to sweep poorly placed stops and shake the “weak hands” out of the trade. This has the effect of absorbing overhead supply, thereby clearing the way for the equity to move higher. When a bullish reversal candle forms after a stock or ETF has “undercut” a key level of support, we refer to this type of buy entry as a “pullback entry” (which is one of the preset technical scans on the new MTG Stock Screener). Pullback entries develop when an ETF gently retraces from the most recent “swing high” of its uptrend and finds technical support at an area of horizontal price support and/or a key moving average. After this happens, it is important to wait for the ETF to form a “pivot,” which allows for a relatively low-risk pullback entry for swing trading. The best buy pivots tend to occur when an ETF or stock forms a bullish reversal candles (such as a “hammer”) that sharply undercut a key support level on an intraday basis, but subsequently recovers to close near the high of the day. When this occurs, our trigger for buy entry of at least partial share size is simply above the high of the reversal candle. Because of the combined “undercut” with reveral candle that IBB formed yesterday, note on today’s watchlist that we have lowered the trigger price for this trade setup.
Although the major indices technically remain in their nearly week-long sideways consolidation patterns, yesterday was the second consecutive day that the broad market rallied late in the day to close near session highs. This type of price action is considered bullish, and suggests that market bulls are buying into weakness. The main thing missing has been the presence of institutional participation, but if volume suddenly comes back into the market, stocks could easily break out above the highs of their holding patterns and resume the rally attempt that began two weeks ago.
stock commentary:
Yesterday, our open position in CBM made a nice move back to test resistance of the intraday high of August 9. On that day, which is when we entered the position, CBM a sharp move higher in the morning, but reversed to close near its intraday low. This time, however, CBM sustained its rally and close near its intraday high, as well as a fresh multi-year closing high. Volume also came in above its 50-day average level. It this stock moves above yesterday’s high of $11.57, it could make a substantial move higher due to the lack of overhead resistance. Below is an updated chart of CBM:
")
There is one new stock on our watchlist for potential trade entry today ($REGN), which is a breakout entry above the high of yesterday’s bullish reversal candle.
If you are a new subscriber, please e-mail [email protected] with any questions regarding our trading strategy, money management, or how to make the most out of this report.
relative strength combo watchlist:
Our Relative Strength Combo Watchlist makes it easy for subscribers to import data into their own scanning software, such as Tradestation, Interactive Brokers, and TC2000. This list is comprised of the strongest stocks (technically and fundamentally) in the market over the past six to 12 months. The scan is updated every Sunday, and this week’s RS Combo Watchlist can be downloaded by logging in to the Members Area of our web site.
NOTE: This week, the Relative Strength Combo Watchlist will not be updated until Wednesday. In the meantime, you may still download the previous week’s watchlist because not much has changed since then.