Sell Mode
– Timing model generated sell signal on close of February 25 (click here for more details)
today’s watchlist (potential trade entries):

Having trouble seeing the open positions graphic above? Click here to view it directly on your web browser instead.
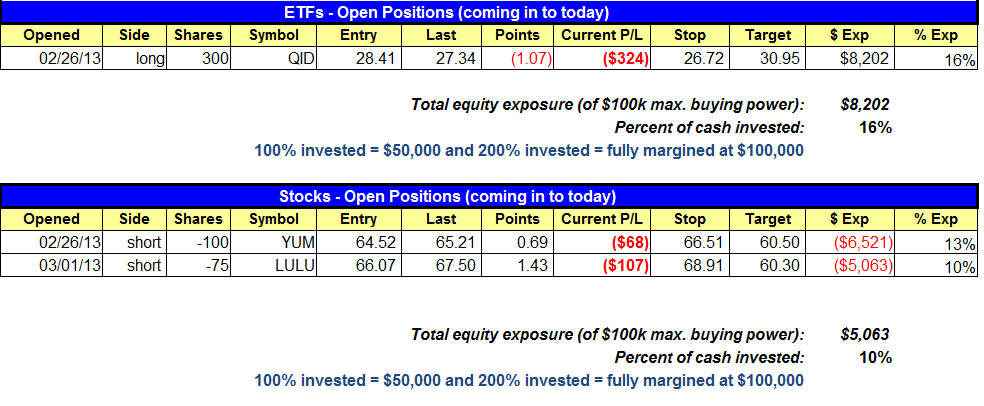
open positions:
Below is an overview of all open positions, as well as a report on all positions that were closed only since the previous day’s newsletter. Net P/L figures are based on two separate $50,000 model portfolios (one for ETFs and one for stocks). Changes to open positions since the previous report are listed in pink shaded cells below. Be sure to read the Wagner Daily subscriber guide for important, automatic rules on trade entries and exits.
Having trouble seeing the open positions graphic above? Click here to view it directly on your web browser instead.
closed positions:
Having trouble seeing the closed positions graphic above? Click here to view it directly on your web browser instead.
ETF position notes:
- No trades were made.
stock position notes:
- $LULU short setup triggered below the 5-minute low on Friday’s open.
ETF, stock, and broad market commentary:
Stocks concluded an indecisive and volatile week of trading with a round of modest gains last Friday, but lighter volume once again confirmed the unwillingness of institutions to step back in and support the buying. The broad market began the day sharply lower, but the major indices edged their way higher throughout the session before finishing with gains of 0.2% to 0.3%. Friday’s reversal action could have been the first sign of accumulation in several weeks and a positive sign for the bulls, but as mentioned above, turnover decreased on both exchanges.
We spent several hours extensively scanning the markets over the weekend, and came to the conclusion that the current market environment is a choppy, sloppy mess. Although large-cap stocks continue to show relative strength, which enabled the Dow Jones Industrial Average to finish at a new 52-week high (on the weekly chart), the important Nasdaq Composite remains well below its prior highs.
Clearly, the market has become fractured over the past two weeks. Like the Dow, the benchmark S&P 500 Index finished the week near its 52-week high. Nevertheless, it is becoming quite apparent that a tug-of-war between the Bulls and bears are starting to take place. To illustrate that, just take a look at the following daily chart of the S&P 500 SPDR ($SPY), a popular ETFs proxy for the S&P 500 Index:

When such major day-to-day volatility starts taking place after an extended rally, it is often a warning sign that a significant correction is about to take place. Furthermore, the Nasdaq remains in a rather precarious position, as the index has been struggling to hold on to key intermediate term support of its 50-day moving average. If the index convincingly breaks down below its 50-day MA in the coming week (by closing below last week’s lows), it will certainly have a substantial drag on even the Dow and S&P 500. Below is the chart of the PowerShares QQQ Trust ($QQQ), an ETF which tracks the performance of the large Nasdaq 100 Index (the brother of the broader-based Nasdaq Composite):

Although the broad market has been “whiplash city” over the past week, it’s important to note the bearish volume patterns in the broad market continue to persist.
Since the February 19 peak, three of the four down days have been on higher volume (“distribution days”), while all four up days have been on lighter volume. While many technical indicators give false signals, volume is the one indicator that never lies because it is a clear footprint of institutional trading activity. Since banks, mutual funds, hedge funds, pension funds, and other institutions control more than 50% of the market’s average daily volume, the direction of the stock market nearly always follows the institutional money flow. Right now, the volume patterns tell us that institutions remain in sell mode (so our market timing model is as well).
Not surprisingly, a majority of the ETFs in our weekend stock scanning have similar chart patterns to the major indices, but we did spot one pocket of relative strength in the healthcare sector. iShares Bitech ($IBB), SPDR Health Care ETF ($XLV) and Vanguard Health Care ETF ($VHT) have either broken out to new 52-week highs or are poised to breakout within the next few days. However, given recent market conditions, a breakout in the current environment would have a higher than usual likelihood of failure. Conversely, low-risk shortselling setups remain minimal as well.
Overall, we do not see any low risk ETF swing trade setups that are presently actionable. Therefore, the best plan of action is to sit on the sidelines primarily in cash until the market shows us the direction of its next move (although we still have one open ETF position in $QID). Remember, we’re not in the business of predicting price action. Rather, we simply plan our trades according to the reaction the market is presenting us at any given time. It’s a much less stressful and more profitable way to run your trading operations over the long-term.
With our timing model in sell mode, we’ll continue to monitor top relative strength stocks but avoid establishing new positions. The top stock on our list is $LNKD, which we have already bought and sold twice for solid gains the past two months. The first buy was in January, from a cup and handle type pattern, which we sold into strength ahead of earnings. The second buy was on a big gap up from earnings on 2/8, which we also sold into strength.
We added one new short position on Friday in $LULU, which gapped lower on the open and triggered an entry below the 5-minute low. $LULU reversed along with the market and closed near the highs of the day. Hopefully, any test of the 200-day MA will fail and the price action eventually breaks down below 65.00.

$YUM also reversed off the lows of the day, but unlike the S&P 500 it did not close above the open. The plan with $YUM is to stick with the original stop and see how the action reacts at support around 63.00 – 63.50 (if it gets there).
We will not add more short exposure until current positions are deep in the money or the S&P 500 breaks the 50-day MA. If short positions do not work and the market does not break down, then we will sit in cash and wait for a buy signal.
If you are a new subscriber, please e-mail [email protected] with any questions regarding our trading strategy, money management, or how to make the most out of this report.
relative strength combo watchlist:
Our Relative Strength Combo Watchlist makes it easy for subscribers to import data into their own scanning software, such as Tradestation, Interactive Brokers, and TC2000. This list is comprised of the strongest stocks (technically and fundamentally) in the market over the past six to 12 months. The scan is updated every Sunday, and this week’s RS Combo Watchlist can be downloaded by logging in to the Members Area of our web site.