market timing model:
BUY (click here for more details)
today’s watchlist (potential trade entries):

open positions:
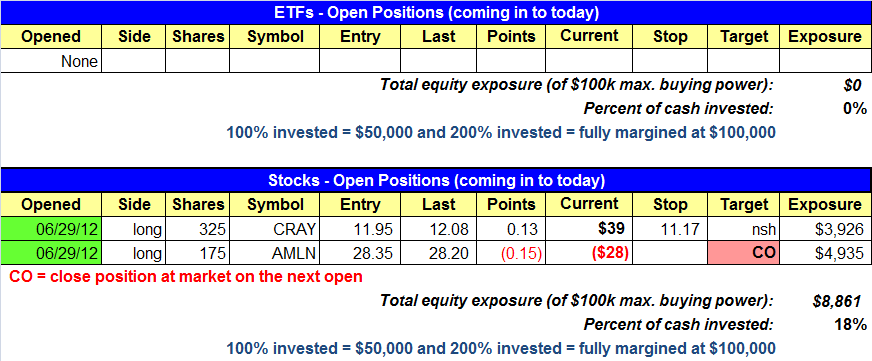
Below is an overview of all open positions, as well as a report on all positions that were closed only since the previous day’s newsletter. Net P/L figures are based on two separate $50,000 model portfolios (one for ETFs and one for stocks). Changes to open positions since the previous report are listed in red shaded cells below. Be sure to read the Wagner Daily subscriber guide for important, automatic rules on trade entries and exits.

Having trouble seeing the open positions graphic above? Click here to view it directly on your web browser instead.
closed positions:

Having trouble seeing the closed positions graphic above? Click here to view it directly on your web browser instead.
ETF position notes:
- Closed open positions at market on the open to limit losses.
stock position notes:
- Closed open positions at market on the open to limit losses.
- Longs AMLN and CRAY triggered.
- BMY announced a buyout of AMLN last Friday. As such, we are selling AMLN at market on the open.
- The share size in ONXX is small due to the width of the stop.
ETF and broad market commentary:
Stocks continued their upward surge on Friday, on strong trade. All five major indices closed more than two percent higher. High beta issues led the charge with the Nasdaq, small-cap Russell 2000 and S&P MidCap 400 posting gains of 3.0%, 2.9% and 2.8% respectively. The S&P 500 tacked on 2.5% while the Dow Jones Industrial Average improved by 2.2%.
Market internals were decidedly bullish yesterday. Volume rose on the NYSE by 17.2% and on the Nasdaq by 8.6%. Advancing volume overpowered declining volume by a ratio of 7.8 to 1 on the NYSE and by a ratio of 5.4 to 1 on the Nasdaq. Yesterday’s heavy volume points to institutional accumulation across both exchanges. Friday was a decisive accumulation day on both the NYSE and the Nasdaq. It was also a bullish follow through day on both exchanges.
During the recent pullback in the market, the Market Vectors Retail ETF (RTH) showed relative strength, as it held support just below its 20-day and 50-day moving averages, while the broad market undercut the 200-day MA. RTH could provide a buying opportunity either on a pullback toward the gap formed on Friday, or if it consolidates for several days to several weeks near the April 27th and June 19th swing highs ($42.71 and $42.50).

We exited all of our ETF positions at the open on Friday. When the market reverses as it did on big volume, it is critical to act decisively and close all short positions. This holds particularly true when dealing with leveraged, inverse ETFs. We now have a confirmed buy signal in the market and our efforts will be focused on identifying long entries on pullbacks in the market.
stock commentary:
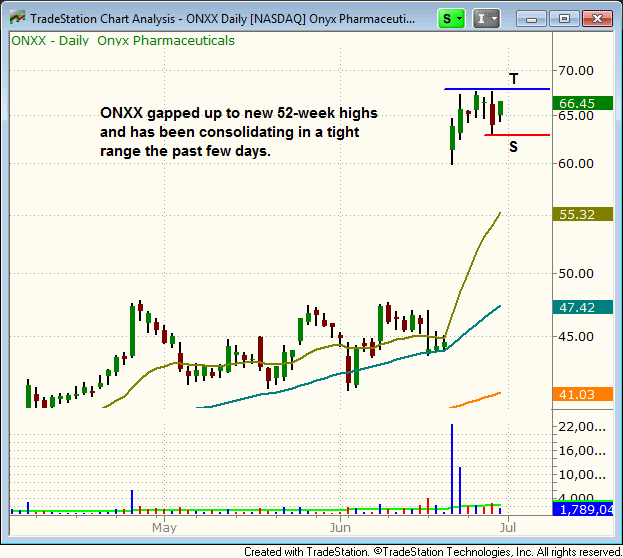
ONXX recently gapped up to new all-time highs and has since consolidated in a fairly tight range. We are looking for a breakout above the range high as a buy entry. Ideally, we’d like to see the price action tighten up a bit more before the setup triggers. However, if ONXX takes off we definitely do not want to miss the move out.

Friday morning we closed open short positions to minimize losses while both official long setups in AMLN and CRAY triggered. Please note that ALMN was bought out by BMY after the close last Friday. As such, we will be selling AMLN at the open on Monday to lock in what should be a quick 7-10% gain (depending on the open). The reason we are not holding on to AMLN is that once a buy out is announced a stock will trade in an extremely tight range until the buyout takes place. There is no upside to staying long.
Friday’s strong price and volume action generated a buy signal on the timing model. Once a buy signal is in we still have to be careful because the market has yet to confirm that it’s ready to stage a meaningful advance, but we can begin to establish a few long positions with reduced share size.
If you are a new subscriber, please e-mail [email protected] with any questions regarding our trading strategy, money management, or how to make the most out of this report.
relative strength watchlist:
Our Relative Strength (or RS) Watchlist makes it easy for subscribers to import data into their own scanning software, such as Tradestation, Interactive Brokers, and TC2000. This list is comprised of the strongest 100 (or so) stocks in the market over the past six to 12 months. The scan is updated every Sunday, and this week’s RS Watchlist can be downloaded by logging in to the Members Area of our web site.