sell
today’s watchlist (potential trade entries):

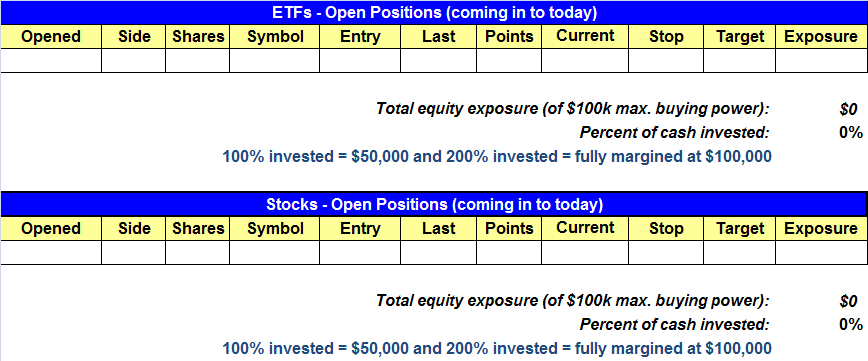
open positions:
Below is an overview of all open positions, as well as a report on all positions that were closed only since the previous day’s newsletter. Net P/L figures are based on two separate $50,000 model portfolios (one for ETFs and one for stocks). Changes to open positions since the previous report are listed in red shaded cells below. Be sure to read the Wagner Daily subscriber guide for important, automatic rules on trade entries and exits.

Having trouble seeing the open positions graphic above? Click here to view it directly on your web browser instead.
closed positions:

Having trouble seeing the closed positions graphic above? Click here to view it directly on your web browser instead.
ETF position notes:
- No trades were made.
stock position notes:
- No trades were made.
ETF and broad market commentary:
Wednesday was a good day for Wall Street. Stocks closed higher across the board on strong trade. All five major indices closed higher by more than two percent. The small-cap Russell 2000 led all indices, as it posted a healthy 2.6% advance. Both the Nasdaq and the Dow Jones Industrial Average gained 2.4%, while the S&P 500 and S&P MidCap 400 tacked on 2.3% and 2.2% respectively
Market internals were decidedly bullish yesterday. Volume surged by 10.4% on the Nasdaq and by 22.6% on the NYSE. Advancing volume trounced declining volume by a ratio of 12.8 to1 on the NYSE and a ratio of 9.6 to 1 on the Nasdaq. It is safe to say that yesterday was an accumulation day across the board.
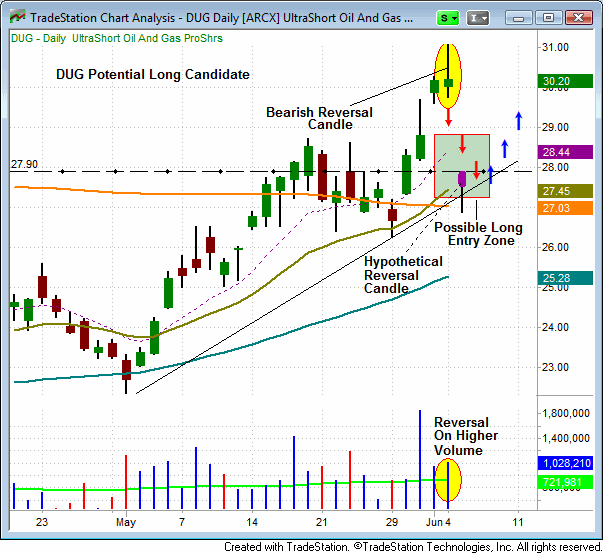
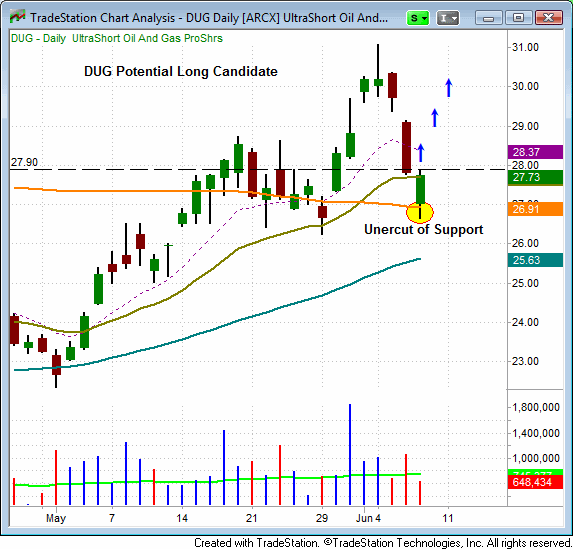
In the June 5th edition of The Wagner Daily, we stated that, “…the ProShares UltraShort Oil and Gas ETF (DUG) formed a distinct bearish reversal candle and could offer a buying opportunity on a pullback into support near its 10-day and 20-day moving averages. On a pullback buy entry, we look for an ETF to undercut a key moving average or support level, and form a reversal candle. The reversal candle then serves as the pivot for a possible trade entry. In this example, the potential long entry would occur on a move above the reversal candle (See June 5th chart below).” Yesterday, on high volume, DUG sold off sharply and closed just above its 20-day. If DUG can undercut its 20-day EMA and form a reversal candle (See second chart of DUG below), it could offer a possible buy entry above the high of that reversal bar.


Yesterday’s accumulation day adds the potential that we could be in the early stages of a market reversal. However, we now need to see another strong accumulation day and avoid further distribution. If we were to see a significant distribution day on the heels of today’s accumulation day, it would be a clear signal that market bears are still in control.
stock commentary:
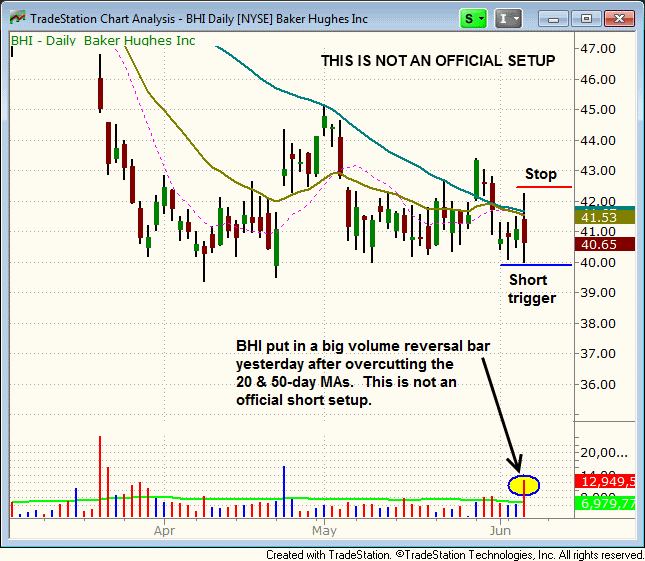
BHI is a potential short entry beneath Wednesday’s reversal candle low. This is not an official setup because BHI is out of sync with the broad market which is just beginning to push higher.

Yesterday’s bullish accumulation day was a step in the right direction for the market. Whether or not we follow through to the upside remains to be seen. Ideally, we would like to see the market consolidate for a few weeks before producing a buy signal so that the stocks have enough time to set up properly.
If you are a new subscriber, please e-mail [email protected] with any questions regarding our trading strategy, money management, or how to make the most out of this report.
relative strength watchlist:
Our Relative Strength (or RS) Watchlist makes it easy for subscribers to import data into their own scanning software, such as Tradestation, Interactive Brokers, and TC2000. This list is comprised of the strongest 100 (or so) stocks in the market over the past six to 12 months. The scan is updated every Sunday, and this week’s RS Watchlist can be downloaded by logging in to the Members Area of our web site.