Current signal generated on close of Feb. 13.
Portfolio exposure can be anywhere from 50% to 100% long (or more), depending on how open positions have held up.
Past signals:
- Sell signal generated on close of February 3.
- Neutral signal generated on close of January 24.
- Buy signal generated on close of November 13
- Buy signal generated on close of September 9
- Neutral signal generated on close of August 15
- Buy signal generated on close of July 11
- Neutral signal generated on close of July 5
- Sell signal generated on close of June 24
today’s watchlist (potential trade entries):

Having trouble seeing the open positions graphic above? Click here to view it directly on your web browser instead.
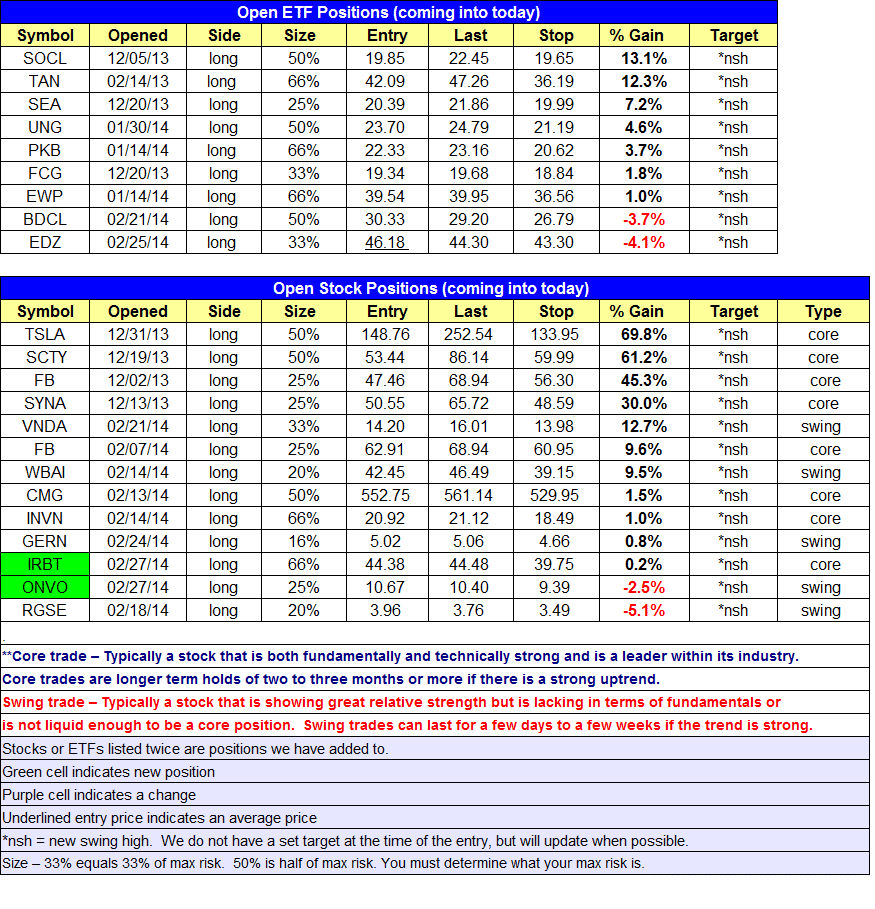
Below is an overview of all open positions, as well as a report on all positions that were closed only since the previous day’s newsletter. Changes to open positions since the previous report are listed in pink shaded cells below. Be sure to read the Wagner Daily subscriber guide for important, automatic rules on trade entries and exits.
Having trouble seeing the open positions graphic above? Click here to view it directly on your web browser instead.
closed positions:

Having trouble seeing the closed positions graphic above? Click here to view it directly on your web browser instead.
ETF position notes:
- No trades were made.
stock position notes:
- $ONVO and $IRBT buy entries triggered.
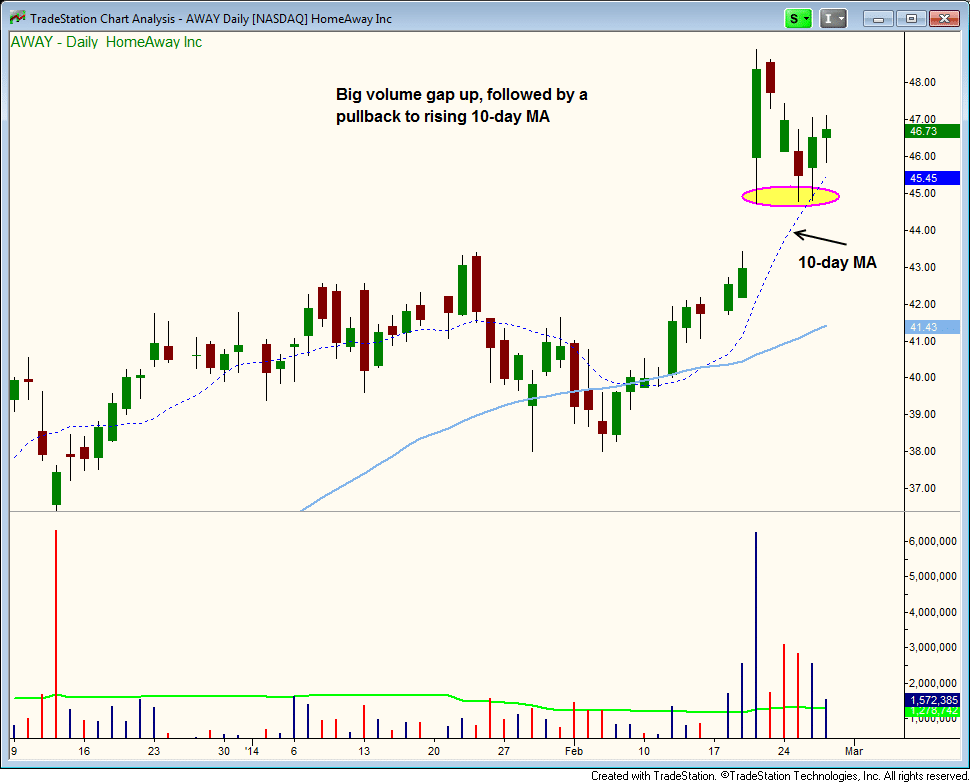
- Note that only one buy setup in $AWAY will trigger, the other is to be canceled. Most brokers should allow you to place two orders at once. If you do not have the ability to do so and you’re serious about your trading, then we recommend moving to a brokerage for active traders such as Interactive Brokers or Tradestation.
ETF, stock, and broad market commentary:
It is usually a bullish sign when an overbought market refuses to pull back in, and that is exactly what we have right now, as the major averages continue to trade above the rising 10-day MA.
The lack of volatility in the market during the past two weeks has made it more of a stock pickers market, as most breakouts to new 52-week highs in leading stocks have worked well.
After printing a big reversal candle on very heavy volume four weeks ago, Guggenheim Shipping ETF ($SEA) has settled into a fairly tight trading range the past few weeks on declining volume. The price action has held above the rising 10-week MA, which is bullish. There was a pick up in volume this week, which is fine as it does not appear that the action will close near the lows of the week.
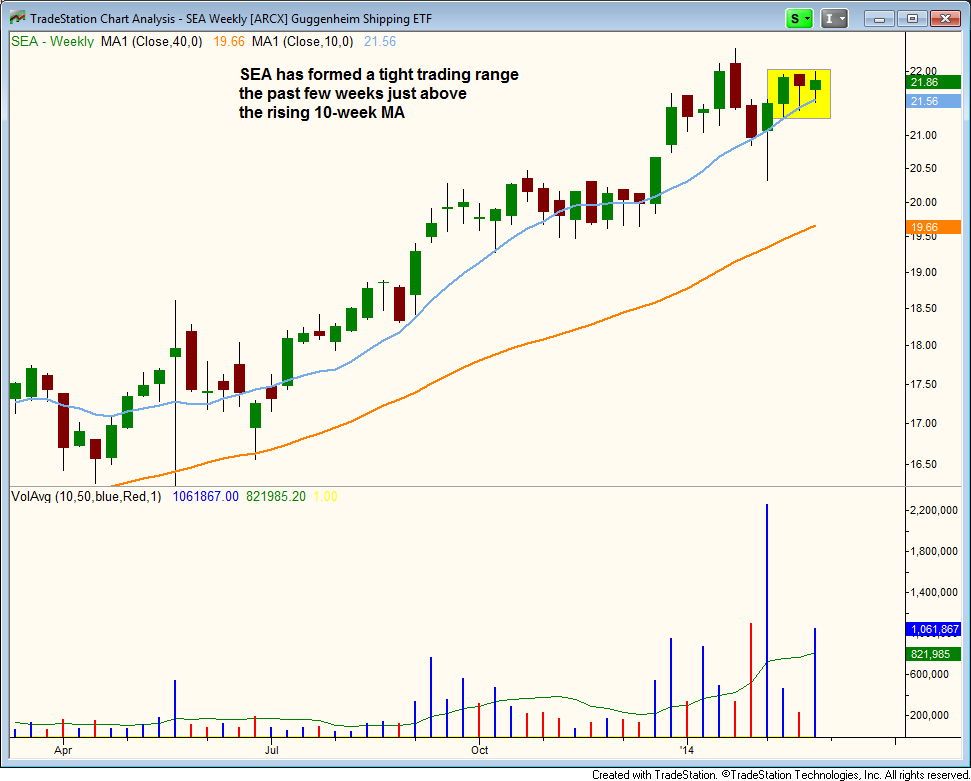
We are looking to add to our current long position in $SEA with a move above the three-week high (see trade details above).
The Euro currency ETF ($FXE) has formed a higher low and is trading in a tight range just above the 10-week MA (light blue). The 10-week has crossed above the 40-week MA (in orange), and both averages are trending higher. The volume has dried up nicely during the consolidation. A dry up in volume is important to quality base building, as it tells us that most traders are no longer interested and are looking elsewhere for action (all the weaker longs are out).
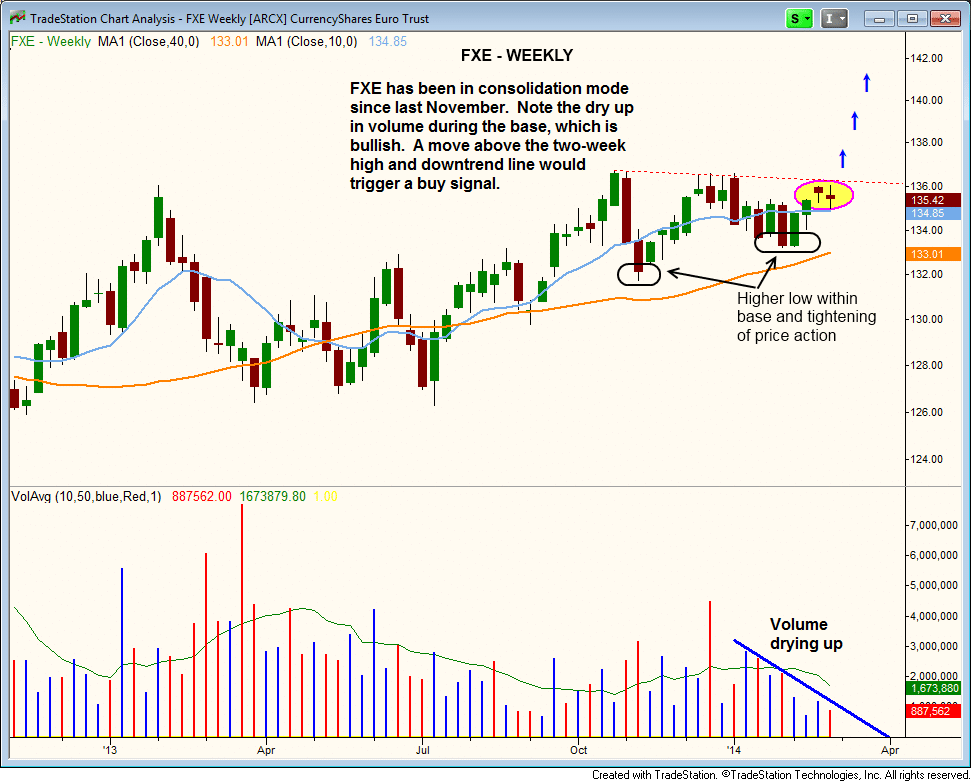
Looking at the monthly chart, we see that there is a breakout on multiple time frames, with $FXE potentially breaking a long-term downtrend line if it can clear the highs of the recent base and hold. The target area would be just shy of $150, around the highs of 2011.
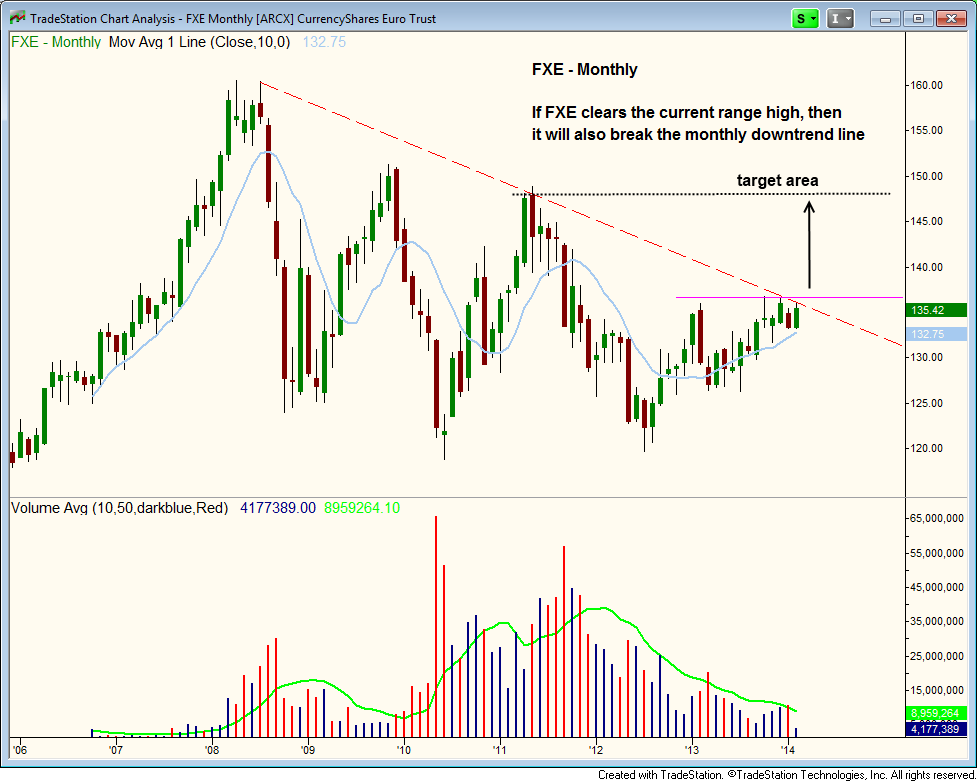
We are not looking to make $FXE an official buy because it trades at a high price with a very small ATR, which is a bad combination. One would need to take a very large position in a portfolio to generate a decent return, leaving very little room for other core trades (that is why we will pass on the trade). Trading the actual forex market is the better route if that is available.
On the stock side, we added two new positions yesterday. $ONVO is a swing setup with a lot of potential if it can reach new 52-week highs. $IRBT formed an inside day on light volume and looks great. A move above Thursday’s high could lead to all-time new highs in short order.
We have one new buy setup today in $AWAY, which is structured much like yesterday’s buy in $IRBT. We have an entry on strength (buy stop) over the prior day’s high. The other entry is on a slight weakness to the rising 10-day MA (buy limit). Whichever setup triggers first is the one we will take, the other is to be canceled.
$AWAY has great potential, as it recently gapped up to new all-time highs on heavy volume. If it can clear the recent high, then it will be trading with no resistance above (just blue skies).
