Confirmed Buy– Signal generated on the close of January 22 (click here for more details)
today’s watchlist (potential trade entries):

Having trouble seeing the open positions graphic above? Click here to view it directly on your web browser instead.
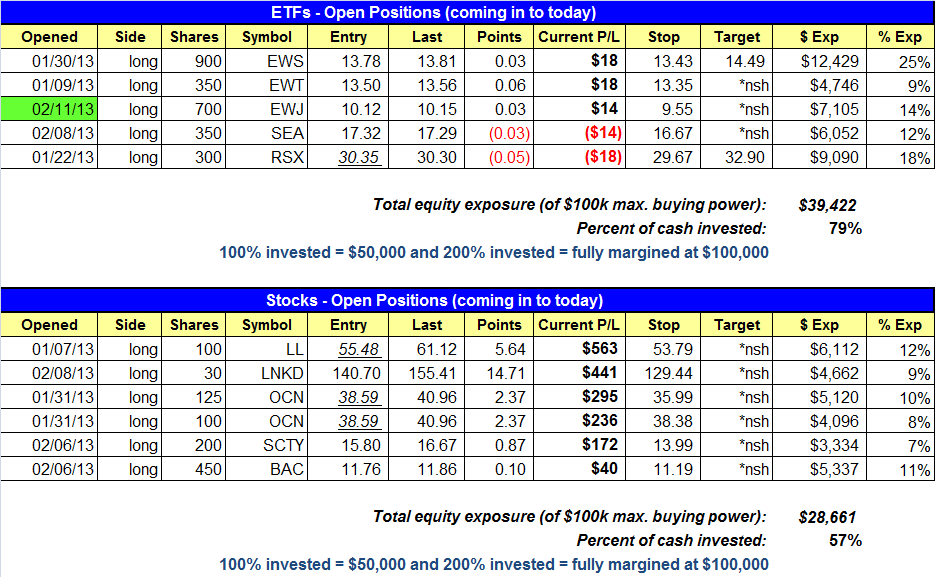
open positions:
Below is an overview of all open positions, as well as a report on all positions that were closed only since the previous day’s newsletter. Net P/L figures are based on two separate $50,000 model portfolios (one for ETFs and one for stocks). Changes to open positions since the previous report are listed in pink shaded cells below. Be sure to read the Wagner Daily subscriber guide for important, automatic rules on trade entries and exits.
Having trouble seeing the open positions graphic above? Click here to view it directly on your web browser instead.
closed positions:
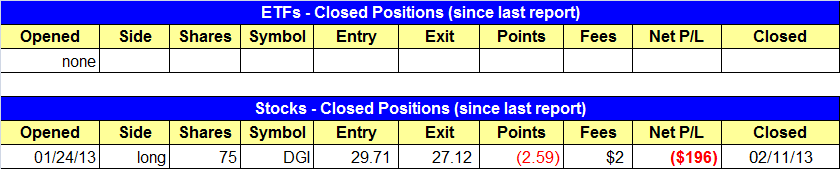
Having trouble seeing the closed positions graphic above? Click here to view it directly on your web browser instead.
ETF position notes:
- $EWJ long triggered.
stock position notes:
- $DGI stop triggered and we are out.
ETF, stock, and broad market commentary:
Stocks closed slightly lower across the board on Monday, with total volume declining on both exchanges. After a quick selloff last Thursday morning, the major indices have bounced back nicely with two days of tight price action.
The market uptrend remains in great shape as we have yet to see any significant loss of momentum the past two weeks. As such, we would view any pullback in the market as a low-risk buying opportunity. In a healthy market, short-term pullbacks are normal, as extended stocks take a break and new breakouts emerge (bullish rotation).
We continue to monitor the iShares FTSE China 25 Index Fund ($FXI) for a low risk entry point on a pullback to the 50-day moving average. On the weekly chart below, the price action has clipped the 10-week moving average, which is basically the same as the 50-day MA on a daily chart.

The 10-week moving average is typically where institutions support a stock/ETF in a strong uptrend. The weekly uptrend line is also providing support; however, this line has only one touch (other than the starting point) in November/December. We prefer to see two touches (plus the original starting point) to produce a reliable support/resistance level on a trendline. For example, if $FXI holds the uptrend line touch here and pushes higher, then it will have had two significant touches (Nov. & Feb.) plus the original starting point. We’d like to see $FXI recapture the 50-day MA on a daily chart before we establish an entry.
The weekly chart of the SPDR S&P Emerging Markets Small Cap ($EWX) is looking pretty bullish. Note the tight-ranged consolidation above the rising 10-week MA after a strong base breakout from $45.00.

A breakout above the range high is the clear entry point in this setup. One could establish small size prior to the breakout, but it is important to wait for a breakout before going in with full size.
On the stock side, we have two new setups in $QIHU and $WAC. We are taking on a half sized position in $WAC on a move above the downtrend line on the daily chart below. The price action has really tightened up the past few days.

$WAC is in the same industry group as $OCN. Having one or two names from a leading group is fine when conditions are ideal. Having 3-4 stocks from the same group might be a bit much unless you normally run 15-20 positions in the portfolio.
Many stocks report earnings over the next two weeks. We will look to hold through earnings if we have a decent profit buffer or if the stock has strong earnings and/or revenues.
If you are a new subscriber, please e-mail [email protected] with any questions regarding our trading strategy, money management, or how to make the most out of this report.
relative strength combo watchlist:
Our Relative Strength Combo Watchlist makes it easy for subscribers to import data into their own scanning software, such as Tradestation, Interactive Brokers, and TC2000. This list is comprised of the strongest stocks (technically and fundamentally) in the market over the past six to 12 months. The scan is updated every Sunday, and this week’s RS Combo Watchlist can be downloaded by logging in to the Members Area of our web site.