market timing model:
Sell – Signal generated on the close of October 12 (click here for more details)
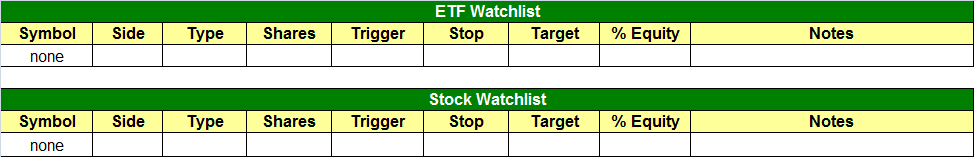
today’s watchlist (potential trade entries):
Having trouble seeing the open positions graphic above? Click here to view it directly on your web browser instead.
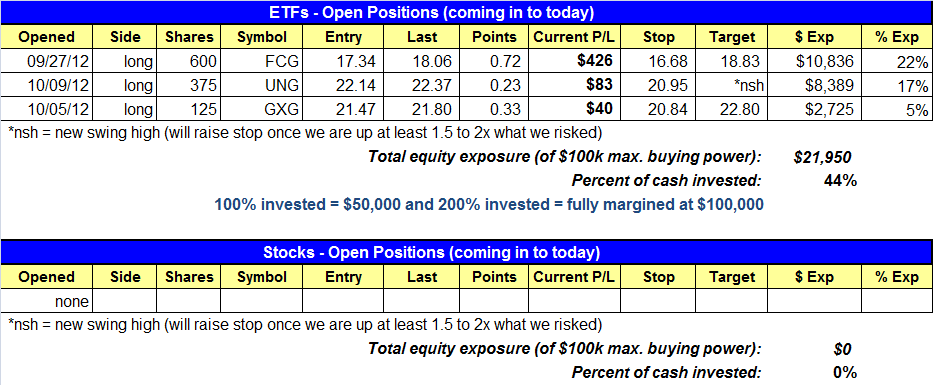
open positions:
Below is an overview of all open positions, as well as a report on all positions that were closed only since the previous day’s newsletter. Net P/L figures are based on two separate $50,000 model portfolios (one for ETFs and one for stocks). Changes to open positions since the previous report are listed in pink shaded cells below. Be sure to read the Wagner Daily subscriber guide for important, automatic rules on trade entries and exits.
Having trouble seeing the open positions graphic above? Click here to view it directly on your web browser instead.
closed positions:

Having trouble seeing the closed positions graphic above? Click here to view it directly on your web browser instead.
ETF position notes:
- AGQ long position stopped out.
stock position notes:
- No trades were made.
ETF and broad market commentary:
Stocks got off to a positive start in the first hour of trading but found difficulty adding to gains in the afternoon, with most averages basically chopping around in to the close. Small and midcap stocks outperformed, with both the S&P Midcap 400 Index ($MID) and small-cap Russell 2000 Index ($RUT) gaining 0.8% on the day, easily beating the next best gain of 0.4% by the S&P 500 Index ($SPX). Noticeable laggards on the day were the Nasdaq Composite (up 0.1%) and the Dow Jones Industrial Average ($DJIA) (flat at 0.0%). The weakness in the Nasdaq is not much of surprise, as the Nasdaq 100 has undeperformed the S&P 500 the past few weeks and did so again on Wednesday, with AAPL closing 0.8% lower. As for the Dow, it did manage to hold in a tight range, fighting off IBM’s nasty 5% sell off on heavy volume.
Wednesday marked the third straight day of accumulation in the market, as total volume on the NYSE and Nasdaq picked up by 4% and 3% respectively. That being said, it was not a clear cut accumulation day for either index and especially so for the Nasdaq, as it closed off the highs of the day. We could argue that there was profit taking on the Nasdaq in to the 50-day moving average. Backing up this argument is the Nasdaq Adv/Decl ratio closing at approx. 1 to 1, which is not a number that we normally associate with a strong up day. The NYSE Adv/Decl ratio was strong at nearly 3 to 1.
While the sharp bounce off the lows in the market has worked off the oversold readings, the averages are now approaching significant resistance. This is where the rubber meets the road. How the averages react in terms of accumulation distribution at key resistance levels should tell us what type of market we are in (is this a short-term bounce or the start of a new rally).
The S&P 500 is clearly in better technical shape and could stall out at the highs, pullback to support of the 20-day EMA, and still be in solid shape.

The Nasdaq 100 ETF ($QQQ)is approaching plenty of overhead resistance in the 68.00 – 69.00 area. We’d like to see the Q’s close back above and hold the 50-day moving average within the next week or two. Whether or not this will happen before another test of the recent swing low remains to be seen, but there are quite a few big cap Nasdaq stocks dragging the index lower (APPL, BIDU, PCLN, ORCL, and QCOM are a few).

Like the S&P 500, SPDR S&P Retail ($XRT) has held above its 50-day moving average during the correction. $XRT’s base is also above the prior highs of April, which are not shown on the chart below. Once prior highs are cleared, the resistance should turn in to support in a healthy market. $XRT could offer a potential low risk entry point within the next several days if the price action can tighten up in the 62.50 to 63.50 area.

As of this moment our timing model remains on a sell signal. Much will depend on how the Nasdaq acts over the next several sessions. If the market is poised for a continuation breakout, then we should see plenty of bullish setups emerge over the next few weeks. Our goal as always is to shy away from predicting price action and focus on reacting to it.
stock commentary:
As mentioned above, the timing model remains on a sell signal. However, we are prepared to shift the model to buy mode as early as tomorrow if a major average can post a 1.5% gain on higher volume (a follow through day). With a follow through day in place, we will look to grab select names from our watchlist. As always, we will let the price action bring us back into the market. Which means if there are not setups to buy on a buy signal….we do not buy anything. If there are 5-10 strong setups we may start off with 3-4 and look to build on success.
Those who entered the unofficial setups in KORS, VRX, and NTE should be in decent shape. One could sell or reduce size in NTE and VRX into strength to lock in some gians. We would hold on to KORS, although there is no guarantee that it will hold up if the market softens. However, KORS has top ranked earnigs and revenue momentum, so it deserves a shot. The only problem we see with KORS is that it does report earnings in early November, so it could potentiall false breakout sometime next week and remain range bound until the report. I would not recommend holding the stock until earnings if there is no follow through from Tuesday’s move.
Many potential setups on our internal watchlist report earnings over the next two weeks. There is much to digest right now in terms of broad market price/volume action and earnings season. For now we remain in cash. That could change shortly.
If you are a new subscriber, please e-mail [email protected] with any questions regarding our trading strategy, money management, or how to make the most out of this report.
relative strength combo watchlist:
Our Relative Strength Combo Watchlist makes it easy for subscribers to import data into their own scanning software, such as Tradestation, Interactive Brokers, and TC2000. This list is comprised of the strongest stocks (technically and fundamentally) in the market over the past six to 12 months. The scan is updated every Sunday, and this week’s RS Combo Watchlist can be downloaded by logging in to the Members Area of our web site.