sell
today’s watchlist (potential trade entries):

open positions:
Below is an overview of all open positions, as well as a report on all positions that were closed only since the previous day’s newsletter. Net P/L figures are based on two separate $50,000 model portfolios (one for ETFs and one for stocks). Changes to open positions since the previous report are listed in red shaded cells below. Be sure to read the Wagner Daily subscriber guide for important, automatic rules on trade entries and exits.

Having trouble seeing the open positions graphic above? Click here to view it directly on your web browser instead.
closed positions:

Having trouble seeing the closed positions graphic above? Click here to view it directly on your web browser instead.
ETF position notes:
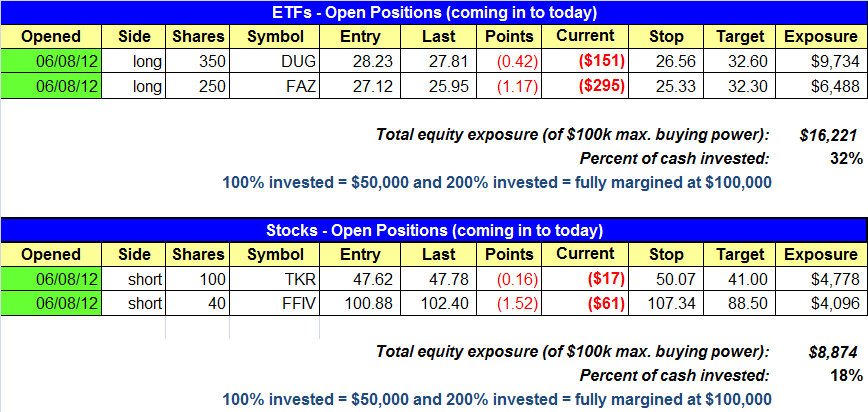
- FAZ and DUG triggered long entries.
stock position notes:
- TKR and FFIV shorts triggered.
ETF and broad market commentary:
Stocks posted solid gains on Friday but trade was light. All of the major indices closed in the black. The small-cap Russell 2000 demonstrated the most strength as it climbed 1.2% on the day. The Nasdaq posted a 1.0% gain, while the S&P MidCap 400 tacked on 0.9%. Both the S&P 500 and the Dow Jones Industrial Average finished 0.8% higher.
Market internals ended the session mixed. Volume was light on both exchanges. On the Nasdaq, turnover slid by 15.3% and on the NYSE by 15.0%. However, advancing volume outpaced declining volume across the board. By the closing bell, the spread ratio stood at a plus 3.9 to 1 on the Nasdaq and a plus 2.5 to 1 on the NYSE. Although Friday’s price action was bullish, volume was weak, thus eliminating any possibility of an accumulation day.
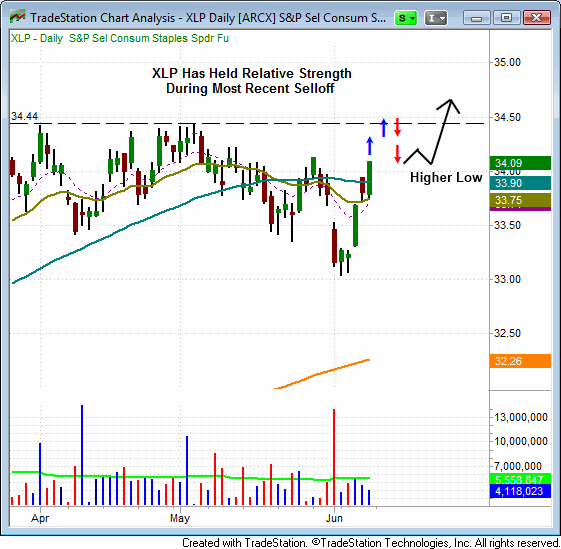
During the recent market correction, XLP has shown relative strength to the broad market. Unlike most ETFs, XLP never came close to testing its 200-day MA. Further, as of Friday, XLP reclaimed support of both its 20-day and 50-day moving averages. XLP could present a buying opportunity on a test of, and pullback from, resistance near its most recent swing high of $34.50. Following a pullback from this level, we would look for XLP to form a lower high and a higher low. The lower high could potentially serve as a buy entry trigger, and the higher low could serve as a stop for the potential entry. It is too early to consider XLP as an official setup. However, since our market timing model could soon provide a buy signal, we must be prepared to seize opportunities on the long side of the market.

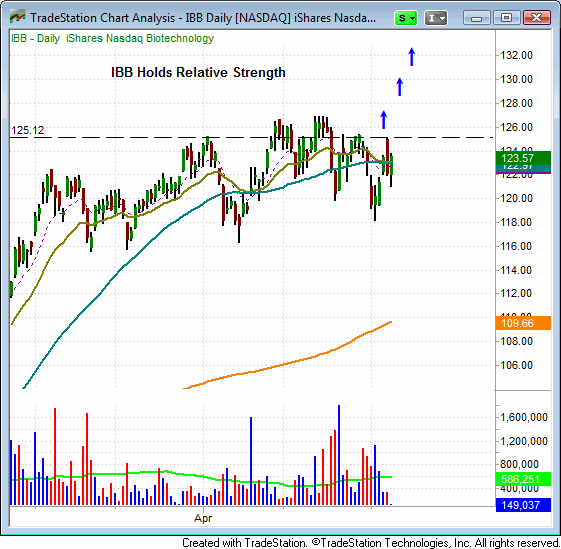
Another ETF that has held relative strength is the iShares Nasdaq Biotechnology ETF (IBB). Since the beginning of 2012, IBB has been consolidating in a range between $116.00 and $127.00. If the market firms up, IBB’s next test of the $127.00 mark could result in a sharp move higher.

Both DUG and FAZ triggered on Friday. If the current futures price action holds, FAZ is likely to hit its stop at the open. If the stop triggers at the open in either or both DUG and FAZ, we will immediately exit the positions. As of this writing, both the Nasdaq and S&P 500 futures are sharply higher. If this price action holds throughout Monday, the market is likely to put in an accumulation day and may also provide a buy signal. However, if we remain in a bear market, false buy signals often occur, and the market can reverse again quickly. In bear markets, it is not unusual to see a buy signal nullified within two or three days of triggering. Still, if we do get a buy signal, the market could easily break out quickly. In the current state of affairs in the market, caution is warranted.
stock commentary:
Friday’s strong closing action in the market negates the prior day’s bearish reversal. Although total volume was light, the odds now favor the market pushing higher for a few more days. Whether this rally can produce a legit buy signal remains to be seen. For the timing model to flash a buy signal we would need to see the Nasdaq or NYSE rally about 1.5% on heavier volume. Once a big volume accumulation day is in we can then begin to establish a few long positions with reduced exposure.
Top long candidates we are monitoring: ARNA MLNX AOL DDD LF AFFY LQDT SXCI WWWW EQIX
If you are a new subscriber, please e-mail [email protected] with any questions regarding our trading strategy, money management, or how to make the most out of this report.
relative strength watchlist:
Our Relative Strength (or RS) Watchlist makes it easy for subscribers to import data into their own scanning software, such as Tradestation, Interactive Brokers, and TC2000. This list is comprised of the strongest 100 (or so) stocks in the market over the past six to 12 months. The scan is updated every Sunday, and this week’s RS Watchlist can be downloaded by logging in to the Members Area of our web site.