Current signal generated on close of August 15.
Portfolio long exposure can be anywhere from 30% to 100% (if your stocks are holding up).
Past signals:
- Buy signal generated on close of July 11
- Neutral signal generated on close of July 5
- Sell signal generated on close of June 24
today’s watchlist (potential trade entries):

Having trouble seeing the open positions graphic above? Click here to view it directly on your web browser instead.
open positions:
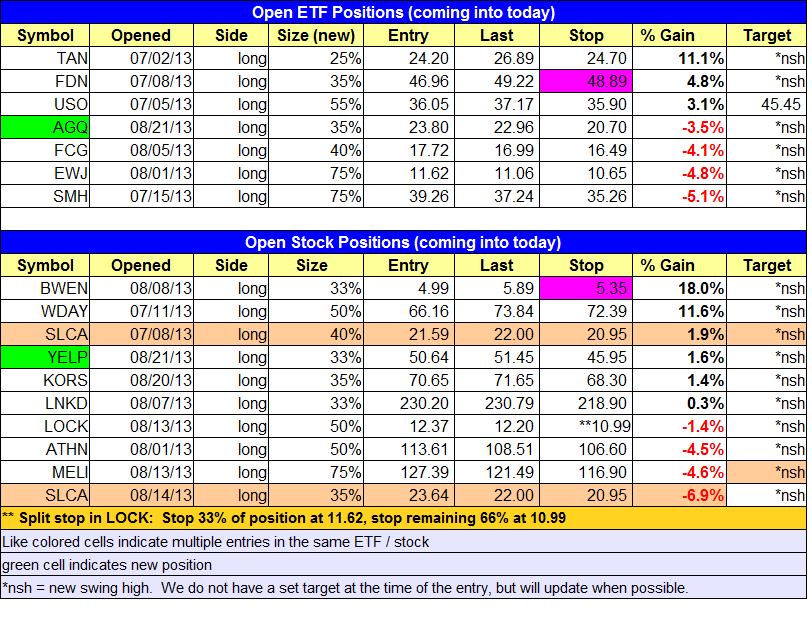
Below is an overview of all open positions, as well as a report on all positions that were closed only since the previous day’s newsletter. Changes to open positions since the previous report are listed in pink shaded cells below. Be sure to read the Wagner Daily subscriber guide for important, automatic rules on trade entries and exits. Click here to learn the best way to calculate your share size.
Having trouble seeing the open positions graphic above? Click here to view it directly on your web browser instead.
closed positions:

Having trouble seeing the closed positions graphic above? Click here to view it directly on your web browser instead.
ETF position notes:
- $AGQ buy setup triggered.
stock position notes:
- $YELP buy setup triggered.
ETF, stock, and broad market commentary:
Volatility picked up late in the afternoon, as stocks rallied more than 1.0% off the lows of the session from 2-3 pm, but gave back most of those gains from 3 to 4 pm. By the close, all major averages were in negative territory, with losses ranging from -0.4% to -0.8%.
For our timing model to generate a buy signal, an index must trade above a swing low for at least four days. Once an index has held above a swing low for a week, we then look for improving volume patterns and a follow through day to confirm that a new bull market is underway. Yesterday’s undercut of the prior swing low in S&P 500 sets the count back to zero. The NASDAQ has held the swing low for two days and will need to hold up for two more.
In last week’s report, we mentioned the relative strength in Direxion Daily China Bull 3x Shares ETF ($YINN). $YINN continues to impress, holding above the 10-day MA since regaining the 50-day MA on July 11. The split daily chart below details the pattern relative strength in $YINN (top chart) vs. $SPY (bottom chart).
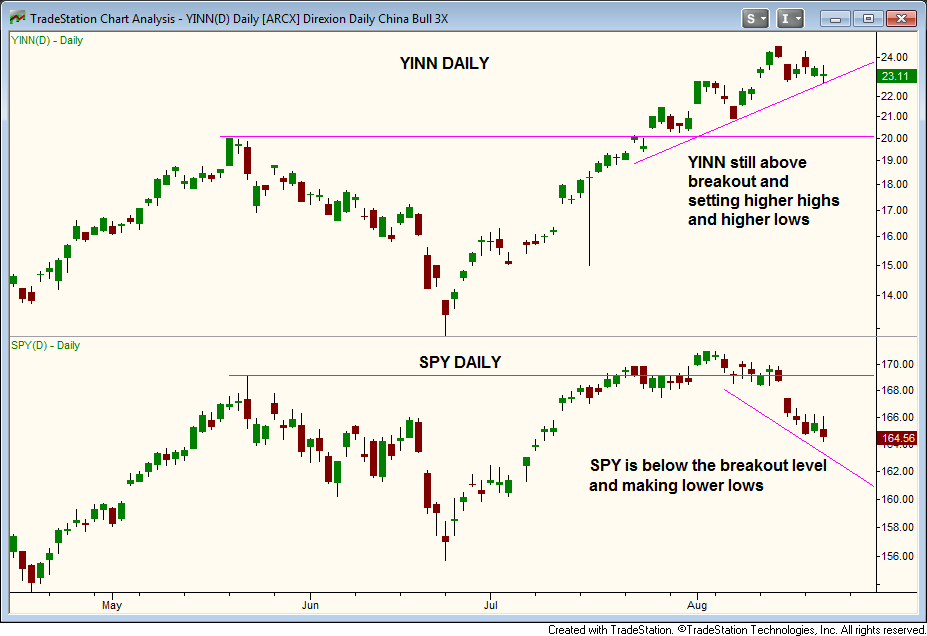
Both charts look the same for the most part until August, when $YINN shows clear relative strength, setting higher swing highs and lows above the horizontal breakout level, while $SPY begins to trend lower.
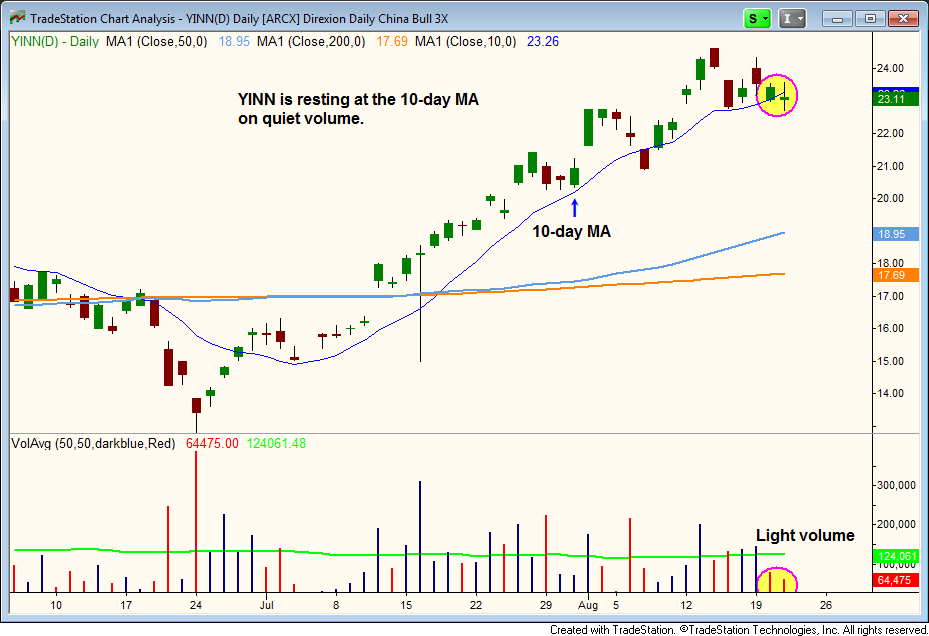
On the daily chart, we see $YINN resting at the 10-day MA while volume has tapered off the past two sessions. We are placing $YINN on today’s watchlist with a fairly tight stop. We refer to this type of trade as a G.O.N.G. setup, which means “go or no go” because of the tight stop. Note that we are also trading with reduced share size.
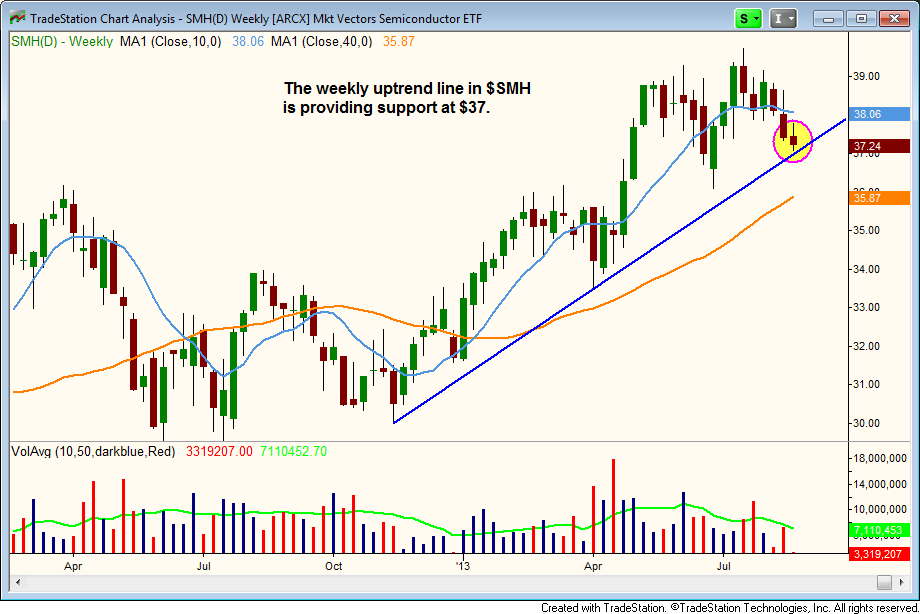
After breaking below the 50-day MA last week, Merrill Lynch Semiconductors HOLDRS ($SMH) is basically in no mans land, trading between the 50 and 200-day MAs. However, there is some support from a weekly uptrend line on the chart below. A move above yesterday’s high could provide decent entry point for those looking to climb aboard $SMH on weakness.
$AGQ buy entry triggered to the penny and then reversed off the day’s high, pulling back in with the broad market averages into the close. A move above Wednesday’s high (plus a few cents) is a logical entry point for those who have not already entered.
On the stock side, the $YELP buy entry triggered with some decent follow through to the upside. There are no new setups today and we may continue to lay low the rest of the week until the market is able to find some traction.
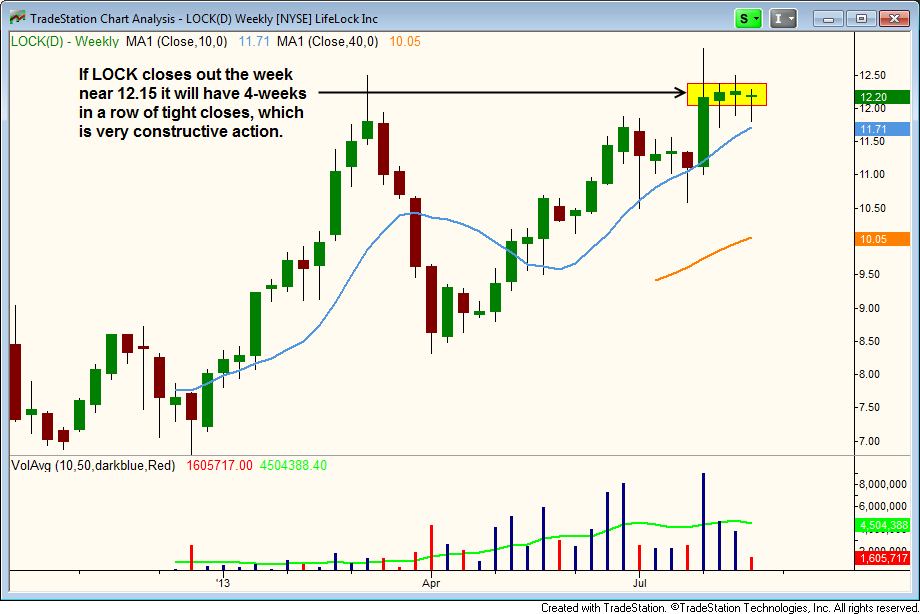
$LOCK is a current long position that has failed to move out from our buy entry, but the weekly chart shows tight closing action over the past few weeks. We would obviously prefer the stock move higher, but consolidating in a tight pattern near 52-week highs is still very constructive action.
