Confirmed Buy– Signal generated on the close of January 22 (click here for more details)
today’s watchlist (potential trade entries):

Having trouble seeing the open positions graphic above? Click here to view it directly on your web browser instead.
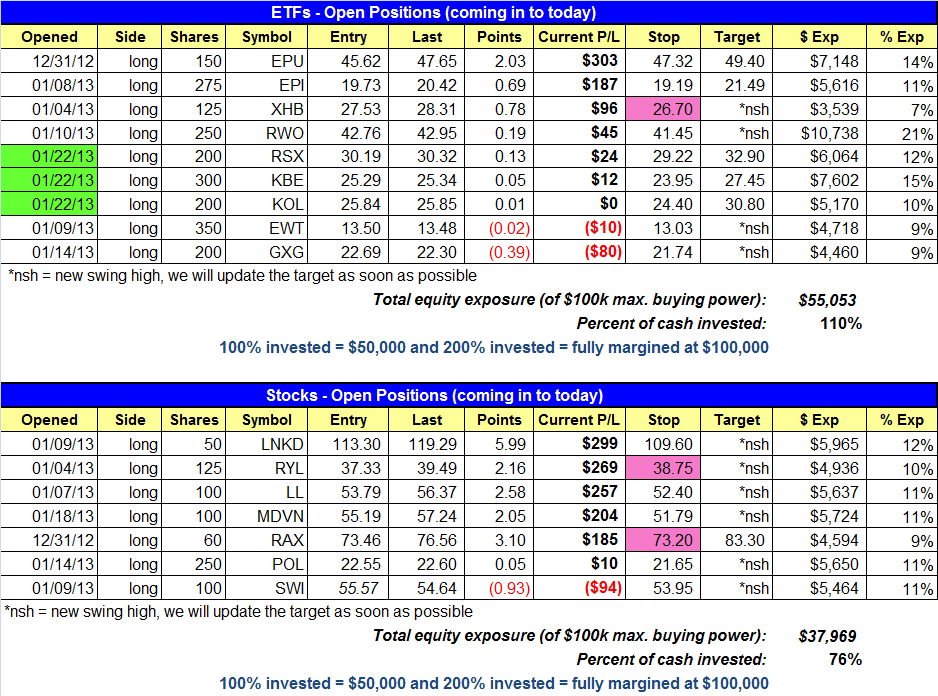
open positions:
Below is an overview of all open positions, as well as a report on all positions that were closed only since the previous day’s newsletter. Net P/L figures are based on two separate $50,000 model portfolios (one for ETFs and one for stocks). Changes to open positions since the previous report are listed in pink shaded cells below. Be sure to read the Wagner Daily subscriber guide for important, automatic rules on trade entries and exits.
Having trouble seeing the open positions graphic above? Click here to view it directly on your web browser instead.
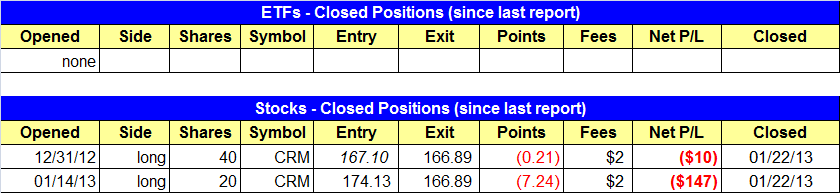
closed positions:
Having trouble seeing the closed positions graphic above? Click here to view it directly on your web browser instead.
ETF position notes:
- $RSX, $KOL, $KBE entries triggered.
stock position notes:
- $CRM sell stop triggered.
ETF, stock, and broad market commentary:
5-Minute Rule:
How to handle stocks/ETFs that trade through our buy stop within the first 5-minutes of trading
- : No buy stops go live until 5 minutes after the stock market opens. So if the price action trades through our buy stop within the first 5-minutes of trading we do nothing and simply wait for 5-minutes. At 9:35 we mark the 5-minute high and add 10 cents to the 5-minute high as the new official entry point. As long as the 5-minute high is not more than 1.3% above the original trigger point the setup is still valid. If the 5-minute high (not adding the 10 cents) is more than 1.3% above our trigger, the trade is automatically canceled.
How to handle a morning gap up above our trigger: If the morning gap up is more than 1.3% above our entry the trade is automatically canceled. If the gap up is less than or equal to 1.3% we wait for 5-minutes to pass and then set a buy stop 10 cents above the 5-minute high, provided that the 5-minute high is not more than 1.3% above the original trigger.
The 5-minute rule does not apply to buy limit orders, where we are looking to enter on weakness. But as with a buy stop order, if a stock/ETF opens more than 1.3% below our buy limit order the trade is automatically canceled.
Once again, buyers stepped up to the plate after some early morning weakness and pushed the averages to new intraday highs by noon. Stocks closed up in the 0.4% to 0.7% range on average, with the Nasdaq Composite showing slight weakness. Volume fell off Tuesday’s pace on both the Nasdaq and NYSE, but as we mentioned in yesterday’s report, accumulation at the highs is not as important once the market has built up enough momentum.
The S&P 500 has followed through to the upside this week with solid price action after closing above the prior highs of September last Friday. It’s hard to believe, but most major averages have ignored the weakness in $AAPL the past few weeks. Due to AAPL’s weighting, the Nasdaq 100 has become quite the laggard index, as it has yet to break above the high from the big gap up on January 2.
Our market timing model is now in confirmed buy mode. Why now? Buy mode is a mechanical signal, but there is a layer of discretion in that we do not have to buy anything if there are no valid basing patterns in our scans. Confirmed buy mode is a 100% discretionary signal. It is based on the success of our open long positions, as well as the success of leading stocks that we do not own. We also factor in broad market conditions (accumulation vs. distribution). Confirmed buy mode simply means that conditions are reliable enough to take on full risk. It is not a timing signal. Buy mode is our market timing signal.
We had a busy day in the ETF portfolio, with $KBE, $RSX, and $KOL triggering long entries. We do not plan on adding new long positions unless a winner is sold or we sell a slower moving position to make room for a potential breakout. However, we do plan on adding to existing positions ($RSX and $EWT) should they move higher.
The iShares FTSE/Xinhua China 25 Index ($FXI) is consolidating near the highs of the last move. Ideally, we would love to see some sort of false breakout action, followed by a selloff to the rising 20-day EMA somewhere around 41.00. Whether it continues to hold near 42.00 or pullback, we feel that $FXI needs another week of sideways action to produce a decent base. It is only 13 days into its current base, and we prefer to see at least 15 to 20 days of basing action before a breakout.

As mentioned earlier, the Market Vectors-Coal ($KOL) buy setup triggered and we are officially long. Looking at the weekly chart below, $KOL still has some work to do as it must break out from its current trading range above 26.00. If it can clear this level, then we could possibly see a move to the 32.00 – 33.00 area, which was a prior support level that will now become resistance on the way up.

We can clearly see that there wasn’t much trading in the 26.00 to 32.00 range on the weekly chart, which means that the price action could easily run to 32.00 if the breakout generates enough momentum. This makes for a very favorable reward to risk ratio, meaning that there is quite a bit of upside (reward) with a fairly tight stop (risk).
On the stock side, $MDVN followed through nicely on Tuesday. $CRM hit our stop and we are out with a smaller than average loss of $150. $CRM’s action was disappointing, but hopefully we can find a new breakout setup to replace it with. We tightened up the stop in $RAX, as any pullback in price should hold above the 20-day EMA if the action is to remain strong. $RYL is scheduled to report earnings early next week. Rather than potentially sitting through a pullback into earnings, we are running a tight stop beneath the two-day low. If it continues to move higher, then great. If not, at least we are able to lock in some profits.
With $LL forming higher swing lows, we could see a tight handle develop over the next week or two. A handle is what we call 1 to 4 weeks of tight price action that is off the lows of the base, but still below the highs of the left side of the pattern. Typically, a handle forms 5-10% off the highs of the left side of the base.

If you are a new subscriber, please e-mail [email protected] with any questions regarding our trading strategy, money management, or how to make the most out of this report.
relative strength combo watchlist:
Our Relative Strength Combo Watchlist makes it easy for subscribers to import data into their own scanning software, such as Tradestation, Interactive Brokers, and TC2000. This list is comprised of the strongest stocks (technically and fundamentally) in the market over the past six to 12 months. The scan is updated every Sunday, and this week’s RS Combo Watchlist can be downloaded by logging in to the Members Area of our web site.