market timing model: Neutral
Current signal generated on close of November 6.Portfolio exposure can be anywhere from 0% to 30% long depending on how individual setups are holding up. Now is not the time to press the long side. Honor stops.Past signals:
- Buy signal generated on close of September 9
- Neutral signal generated on close of August 15
- Buy signal generated on close of July 11
- Neutral signal generated on close of July 5
- Sell signal generated on close of June 24
today’s watchlist (potential trade entries):

Having trouble seeing the open positions graphic above? Click here to view it directly on your web browser instead.
open positions:
Below is an overview of all open positions, as well as a report on all positions that were closed only since the previous day’s newsletter. Changes to open positions since the previous report are listed in pink shaded cells below. Be sure to read the Wagner Daily subscriber guide for important, automatic rules on trade entries and exits.

Having trouble seeing the open positions graphic above? Click here to view it directly on your web browser instead.
closed positions:

Having trouble seeing the closed positions graphic above? Click here to view it directly on your web browser instead.
ETF position notes:
- $YCS did not officially trigger due to the 5-minute rule yesterday. The 5-minute rule will not apply to today’s purchase, but the 1.3% gap rule is still in effect. Note that the first entry in $PALL is a limit order.
stock position notes:
- No trades were made.
ETF, stock, and broad market commentary:
Stocks sold off in the morning and early afternoon before finding support and pushing well off the lows of the session into the close. The S&P 500, S&P 400, and Dow Jones lost 0.2%, while the NASDAQ Composite and Russell 2000 closed flat.
For the second day in a row, the trading range was fairly tight, as broad market averages continue to consolidate just below the highs of last Thursday’s heavy volume distribution day.
Since October 10th, the Dow Jones and S&P 500 has led the market higher while leadership stocks have lagged, which is a big concern. Although the S&P 500 and Dow Jones could easily break out to new highs from here, we would wary of a breakout to new highs in these averages that is not confirmed by strength in leading names.
After several months of having at least 10 to 15 or more open long positions combined in the ETF and stock portfolios, we are now sitting in a 100% cash position with a few buy setups on the watchlist. We continue to lay low for the most part while waiting for new setups to develop, long or short. Now is not the time to be stepping on the gas with regard to long positions.
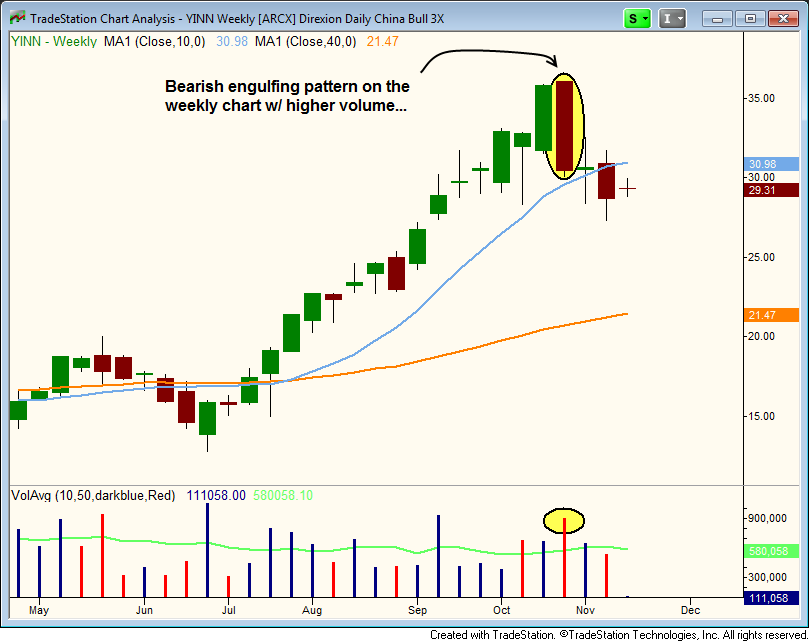
After a 180% run up off the lows of June, Direxion Daily China Bull 3x ($YINN) finally looks to have run out of steam after printing a bearish engulfing pattern on the weekly chart below. Note the pick up in volume on the bearish reversal as well.
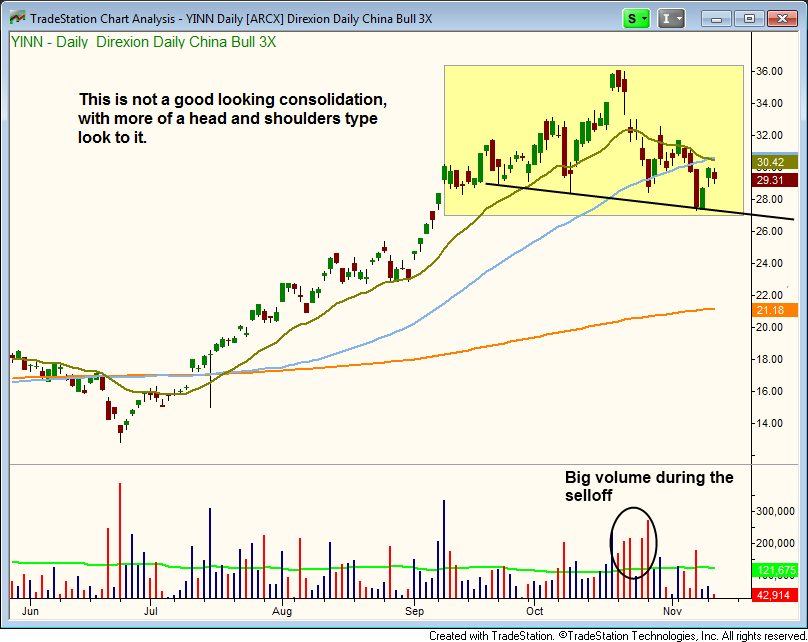
On the daily chart, $YINN has the look of a bearish head and shoulders pattern created by a sharp reversal off the highs on heavy volume in late October. $YINN is a potential short setup if it can form a reversal candle after a bounce into the 50-day MA.
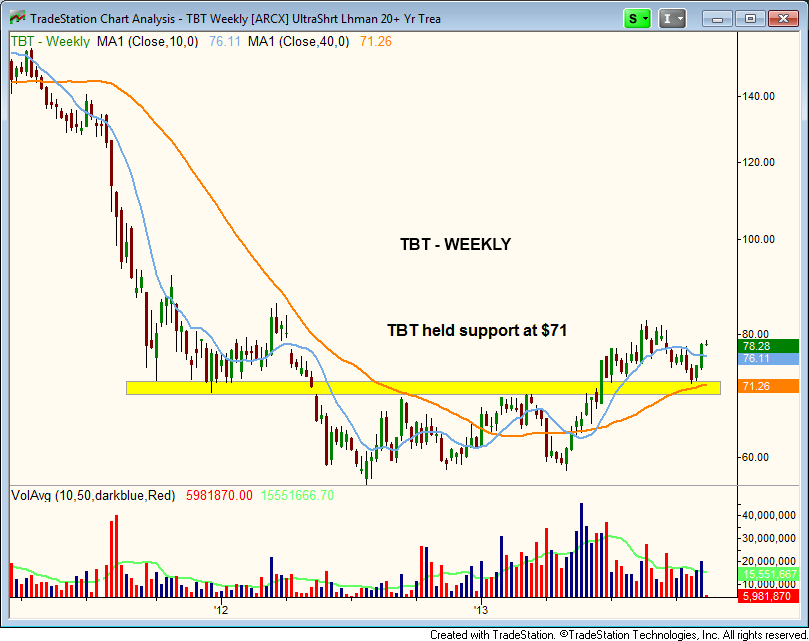
Have long-term interest rates bottomed out? The double bottom pattern and subsequent rally on big volume in May and June on the monthly chart below suggests so.
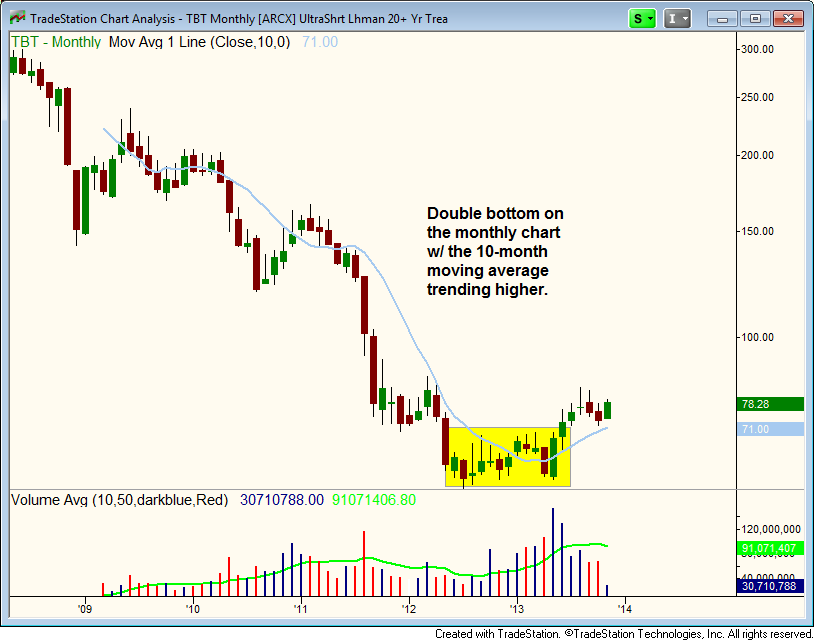
The 10-month moving average is now trending higher, as $TBT looks to be forming a bullish, tight-ranged consolidation the past few months.
The weekly chart below shows $TBT finding support at $71, just above the 40-week MA, which is roughly the same as the 200-day MA or 10-month MA. The 10-week MA (blue) is well above the 40-week MA (orange), and the 40-week MA is now above the prior highs from Jan. through March of this year. The 10-week MA has recently turned lower, which suggests $TBT may need to consolidate a few more weeks before resuming its uptrend.
$TBT is not actionable right now, but we will continue to monitor the price for a low risk entry point on a pullback to the 10-week MA.
On the stock side we remain in S.O.H mode (sit on hands). We would love to be buying new breakouts right now with full confidence, but that simply isn’t the case. We must be patient and wait for new setups to develop in either direction.
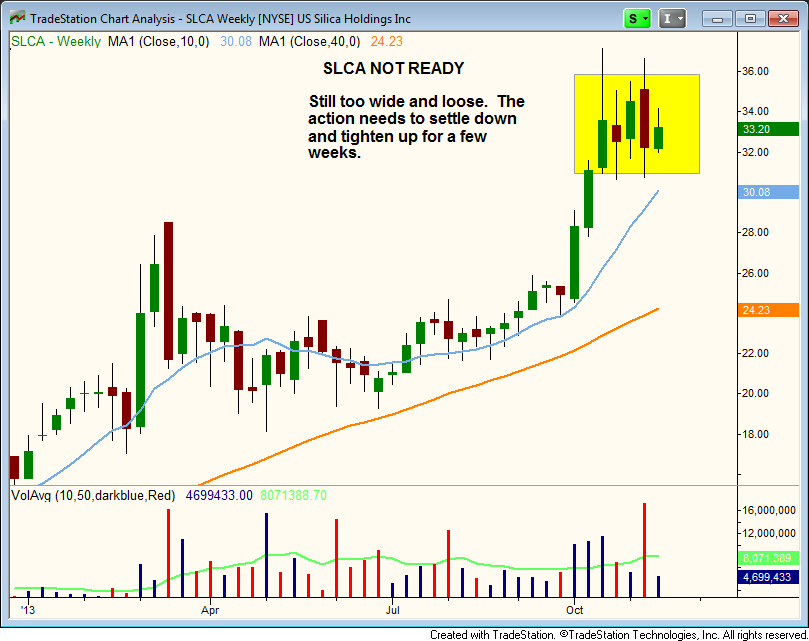
It is still too soon to re-enter $SLCA, which is easy to see on the weekly chart below because the price action has failed to tighten up.
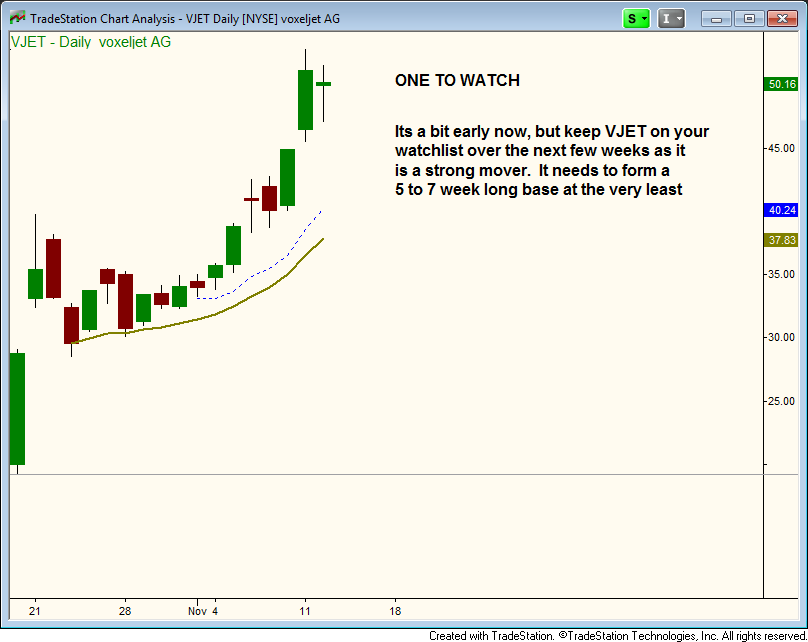
$VJET is a recent IPO and one to watch over the next 4-8 weeks for a bullish basing pattern to form.