market timing model:
Neutral – Signal generated on the close of August 2 (click here for more details)
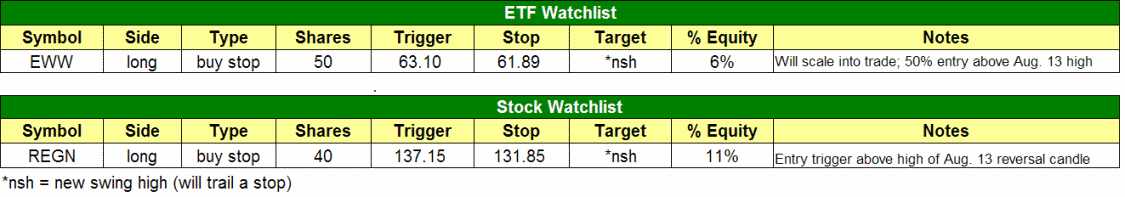
today’s watchlist (potential trade entries):
Having trouble seeing the open positions graphic above? Click here to view it directly on your web browser instead.
open positions:
Below is an overview of all open positions, as well as a report on all positions that were closed only since the previous day’s newsletter. Net P/L figures are based on two separate $50,000 model portfolios (one for ETFs and one for stocks). Changes to open positions since the previous report are listed in pink shaded cells below. Be sure to read the Wagner Daily subscriber guide for important, automatic rules on trade entries and exits.

Having trouble seeing the open positions graphic above? Click here to view it directly on your web browser instead.
closed positions:
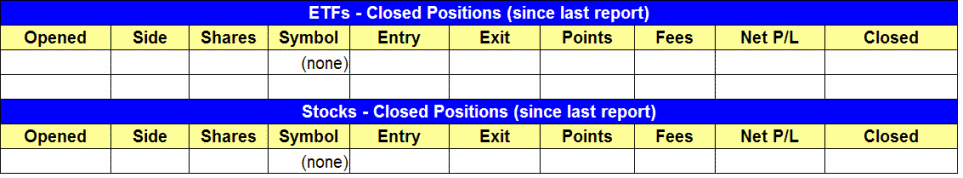
Having trouble seeing the closed positions graphic above? Click here to view it directly on your web browser instead.
ETF position notes:
- Yesterday, both IBB and DVY triggered for buy entry off of yesterday’s watchlist. Both positions closed near the flat line, although it’s notable that IBB held up well (showed relative strength) during the late-day decline in the broad market.
- EWW did not yet trigger for buy entry, but remains on the watchlist.
stock position notes:
- As anticipated, CBM followed through on momentum of its prior day’s rally. The stock gapped up above resistance and surged 8% to a new high. It also did so on nearly 3 times its average daily volume, which helped to confirm the breakout. Considering the weak afternoon price action in the broad market, CBM showed rather impressive relative strength yesterday. Presently, the CBM trade is showing an unrealized gain of 11% since our August 9 entry. In healthy markets, we typically look for an average gain of 15% to 20% for most stock swing trades. But given that the stock market continues to show mixed signals and our market timing model remains in “neutral” mode, we can’t be too greedy with this trade. Further, the trade is already showing an unrealized gain of 3 times our initial risk ($600 gain vs. $200 initial risk). Whenever the “reward” exceeds at least double the initial “risk” on a trade (2:1 reward-risk ratio), we typically tighten the stop to protect profits in the event of a pullback. However, rather than trailing a stop in an attempt to increase potential profits, we are making a judgment call to just lock in the quick 11% gain on this trade. As such, we will be selling CBM at market on today’s open.
- ONXX showed relative strength yesterday by gaining 1.1% as the Nasdaq lost 0.2%. Same stop.
- EQIX remains in a tight consolidation pattern, on light volume, and its volatility contraction should soon lead to a break out of the range. Same stop.
- REGN did not trigger for buy entry yesterday, but remains on today’s watchlist with same trade parameters.
ETF and broad market commentary:
Stocks got off to an encouraging start yesterday, as the Nasdaq and S&P 500 indices gapped to open above the highs of their week-long consolidation patterns. However, in an opposite pattern of the preceding two days, the broad market reveresed in the afternoon, causing the main stock market indexes to fade to new intraday lows and settle back in the confines of their previous trading ranges. Both the S&P 500 and Dow Jones Industrial Average finished unchanged. The Nasdaq Composite surrendered an earlier gain of 0.4% to close 0.2% lower. The S&P MidCap 400 and small-cap Russell 2000 indexes slipped 0.2% and 0.3% respectively.
On the surface, the actual closing prices of the major indices were not that bad. However, a closer look “under the hood” reveals a more bearish picture. In both the NYSE and Nasdaq, total volume jumped approximately 17% above the previous day’s levels. Further, declining volume exceeded advancing volume by just over 3 to 2 in the Nasdaq. The NYSE adv/dec volume ratio was marginally negative. Overall, yesterday’s higher turnover across the board hinted at stealth institutional selling into strength. Yesterday also marked the first “distribution day” (higher volume decline) on the Nasdaq since August 2nd. The NYSE escaped the same label of distribution because it was flat on the day. Although it’s negative for the Nasdaq to print a “distribution day” on its first breakout attempt above its recent trading range, it typically takes at least 3 or 4 such days of higher volume selling to convincingly kill an uptrend in the market.
Despite the distribution in the Nasdaq Composite Index, it is positive to note that the large-cap bretheren of that tech-heavy index, the Nasdaq 100 Index, still managed to close above the prior resistance (new support) of its consolidation pattern. This is shown below on the 60-minute (hourly) chart of PowerShares QQQ Trust ($QQQ), a popular ETF proxy for the Nasdaq 100 Index:
")
Going into today’s session, keep a close eye on whether or not $QQQ manages to hold support of yesterday’s intraday low. If it does, we could see another rally attempt to push stocks back above their consolidation patterns. However, if $QQQ falls below yesterday’s low, we would not be surprised to see a swift return back down to test the lows of the recent sideways trading ranges. Also, the stock market still needs to see at least a bit of relative strength in the small and mid-cap growth indexes in order to have a powerful follow-through rally. Therefore, you may wish to monitor the day to day price action of both $IWM (iShares small-cap Russell 2000 Index) and $MDY (S&P Midcap SPDR).
Although yesterday resulted in a bearish “distribution day” on the Nasdaq Composite, volume still limped in below its 50-day average level, so it was not a massive wave of selling. Further, the NYSE did not confirm the move. Overall, stocks still appear positioned for a move higher, but as we discussed in yesterday’s newsletter, volume needs to pick up on the buy side if we are to see a sustainable move higher. The “neutral” mode of our market timing model indeed remains the correct bias at the present time.
stock commentary:
Given the potential for the major indices to fail yesterday’s breakout attempt above their recent consolidation patterns, we are laying low with regard to new swing trade entries until we get further price confirmation and follow-through in existing open positions (other than CBM). We’re keeping REGN on the watchlist for now, but no additional trade setups today. In case you missed it, please see the “stock position notes” section above for a detailed, educational explanation of our trade management strategy for CBM.
If you are a new subscriber, please e-mail [email protected] with any questions regarding our trading strategy, money management, or how to make the most out of this report.
relative strength combo watchlist:
Our Relative Strength Combo Watchlist makes it easy for subscribers to import data into their own scanning software, such as Tradestation, Interactive Brokers, and TC2000. This list is comprised of the strongest stocks (technically and fundamentally) in the market over the past six to 12 months. The scan is updated every Sunday, and this week’s RS Combo Watchlist can be downloaded by logging in to the Members Area of our web site.
NOTE: This week, the Relative Strength Combo Watchlist will not be updated until Wednesday evening (Aug. 15). In the meantime, you may still download the previous week’s watchlist because not much has changed since then.