Buy
– Signal generated on the close of April 30
Due to the recent distribution in the Nasdaq, we are no longer in confirmed buy mode (now is not the time to step on the gas). We remain in buy mode, but if market conditions continue to deteriorate the timing model will shift to sell mode.
today’s watchlist (potential trade entries):

Having trouble seeing the open positions graphic above? Click here to view it directly on your web browser instead.
open positions:
Below is an overview of all open positions, as well as a report on all positions that were closed only since the previous day’s newsletter. Net P/L figures are based a $100,000 model portfolio. Changes to open positions since the previous report are listed in pink shaded cells below. Be sure to read the Wagner Daily subscriber guide for important, automatic rules on trade entries and exits.

Having trouble seeing the open positions graphic above? Click here to view it directly on your web browser instead.
closed positions:

Having trouble seeing the closed positions graphic above? Click here to view it directly on your web browser instead.
ETF position notes:
- No trades were made.
stock position notes:
- No trades were made.
ETF, stock, and broad market commentary:
Stocks rallied for the second day in a row with strong gains across the board. The Nasdaq and S&P 500 both closed up 1.3%; however, turnover failed to confirm the move once again as volume was lighter on both exchanges. Volume can always come in to the market in a week or two, but the major averages must hold on to recent swing lows and avoid further distribution.
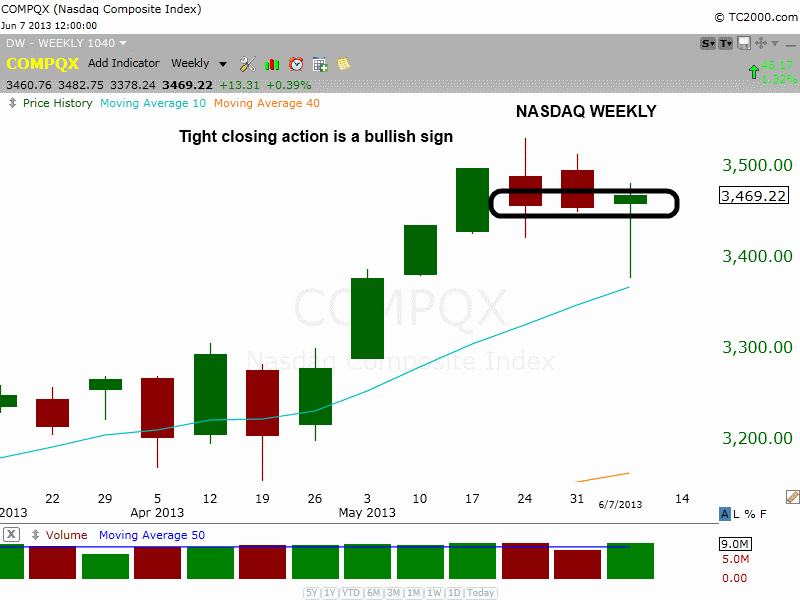
The weekly chart of the Nasdaq Composite below shows the tight closing action over the past few weeks.

After a strong four week advance, the Nasdaq has basically consolidated in a tight, sideways range above the rising 10-week MA…..not bad! That is constructive price action and usually not the sign of a market that is in trouble.
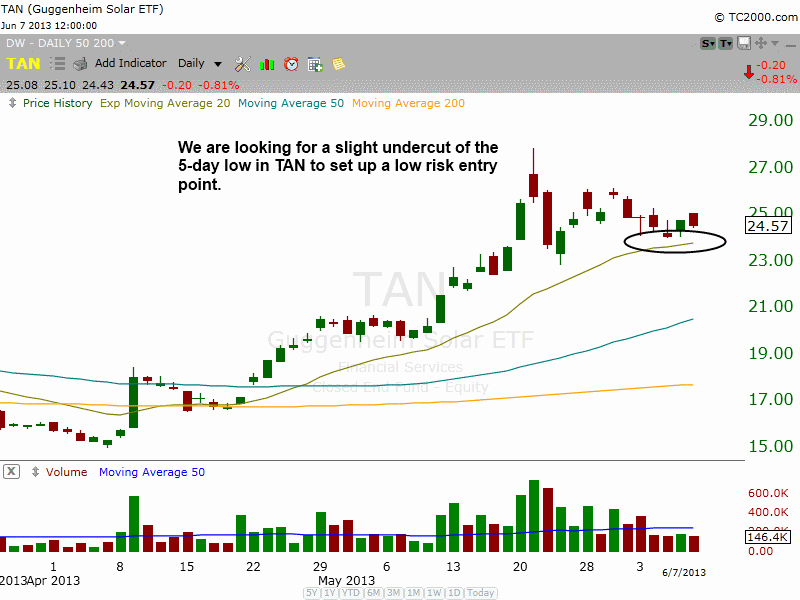
We continue to monitor Claymore/MAC Global Solar Index ($TAN) for a low risk buy entry. After two weeks of consolidating in a tight sideways range, we’d like to see a slight undercut of the 20-day EMA within the next few days.

Why do we want to see $TAN undercut (shakeout) the 20-day EMA first before moving higher? Shakeouts are a good thing, as they wash out all the weak holders with stops at obvious levels. Getting stopped out at an obvious level isn’t wrong, but some traders will not re-enter a trade if it sets up again because they stopped out the first time, and that is very wrong. Many will sit and watch the stock go higher and higher until they can’t take it anymore, and then they finally buy back in. But at this point the stock is already extended and due for a pullback. So as soon as the stock pulls back in, the trader who bought late feels that his entry was all wrong and he exits after a few hours of weakness. After selling, the stock pops right back up and runs higher and our trader is extremely frustrated and now feels the urge to buy back in. The psychology of trading plays a big role in the shakeout.
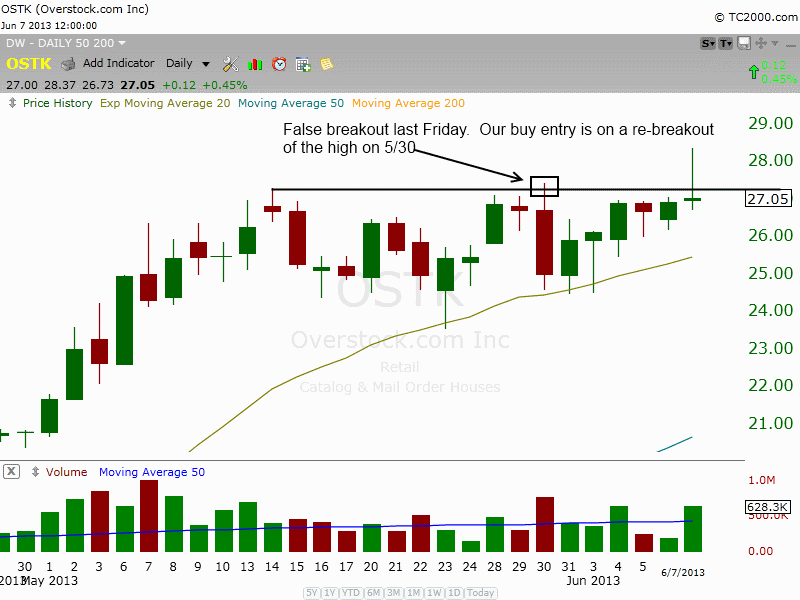
Last Friday’s breakout attempt in Overstock.com ($OSTK) failed and the price action closed near the lows of the session.

The breakout is not dead just yet, especially if $OSTK climb back above the high of May 30 at 27.45. We are placing $OSTK on today’s watchlist as an official buy a few cents over the 5/30 high. If the setup does trigger, then we would expect $OSTK to follow through to the upside within the next few days without dipping much below Friday’s low.

Note that we lowered the stop for 50 shares in $KORS to just below the 5/23 low. The stop on 100 shares remains at 59.40. If $KORS is a legit breakout then it should hold above the 20-day EMA minus a little room for a quick shakeout below $61.