market timing model: Buy
Current signal generated on close of September 9.Portfolio exposure can be anywhere from 25% to 100% long depending on how individual setups are holding up. If you find yourself with 100% exposure and most positions are not up much, you may wanna chop your size down by a third or more. Remember to add more positions, some of your existing positions must be doing well.Past signals:
- Neutral signal generated on close of August 15
- Buy signal generated on close of July 11
- Neutral signal generated on close of July 5
- Sell signal generated on close of June 24
today’s watchlist (potential trade entries):

Having trouble seeing the open positions graphic above? Click here to view it directly on your web browser instead.
open positions:
Below is an overview of all open positions, as well as a report on all positions that were closed only since the previous day’s newsletter. Changes to open positions since the previous report are listed in pink shaded cells below. Be sure to read the Wagner Daily subscriber guide for important, automatic rules on trade entries and exits.

Having trouble seeing the open positions graphic above? Click here to view it directly on your web browser instead.
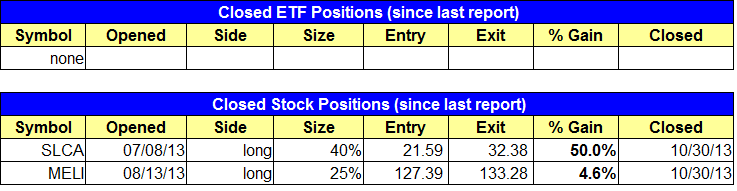
closed positions:
Having trouble seeing the closed positions graphic above? Click here to view it directly on your web browser instead.
ETF position notes:
- $IYM buy setup triggered.
stock position notes:
- Sold $SLCA to lock in a 50% gain. Sold partial size in $MELI below the 20-day EMA.
ETF, stock, and broad market commentary:
Stocks opened slightly higher on the session, but failed to follow through and sold off the rest of the day. The small-cap Russell 2000 was hit the hardest, giving back 1.5%.
The percent losses in the NASDAQ Composite and S&P 500 were limited to -0.5%; however, volume did pick up slightly on both exchanges, producing a distribution day for the NASDAQ and S&P 500.
Yesterday was the first full day of selling that we’ve seen in the S&P 500 in several weeks, and with the major averages extended in the short-term, the market may finally pull back in for a few days.
Leadership stocks struggled yesterday, and have for the past few weeks. Some remain in great shape, like $AMZN and $GOOG, while others are just basing out like $YELP and $KORS.
$LNKD has lost the 50-day MA, and may need a deeper correction. The same goes for $TSLA, though both $KORS and $TSLA appear to be normal pullbacks within an uptrend for now.
Market Vectors Gold Miners ETF ($GDX) has been in pullback mode since late August, but recently broke the downtrend line of the consolidation (10/22) before stalling out at the 50-day MA.
Yesterday, $GDX sold off sharply in the afternoon, but bounced back immediately, finding support at the 20-day EMA. The action produced a bullish reversal candle on the daily chart, and possibly created a higher swing low IF yesterday’s low is able to hold.
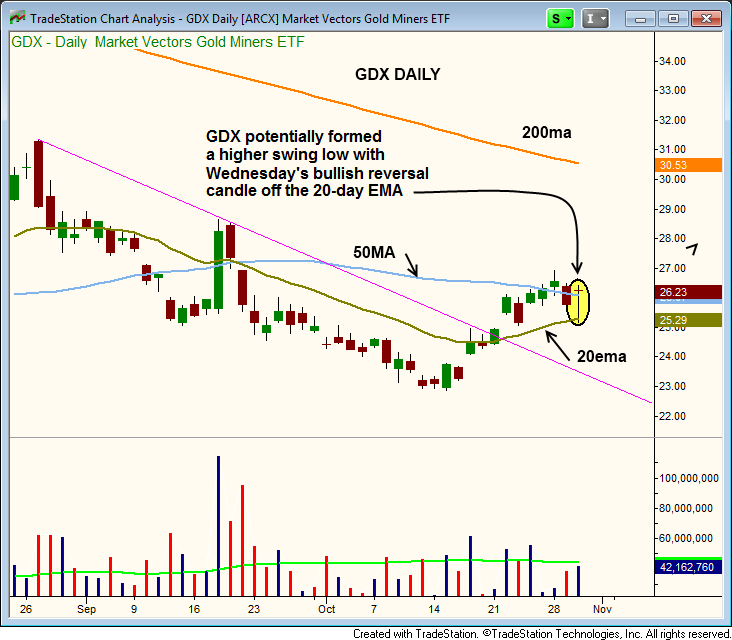
We are stalking $GDX for a buy entry over yesterday’s high, as we look for the action to follow through on yesterday’s reversal and potentially run up to the $29.00 – $30.00 area in the short-term.
Note that the 50-day MA is well below the 200-day MA, and the 200-day MA is still in a clear downtrend, which means that $GDX is a counter-trend buy setup (this is a short-term trade with reduced share size). On the ETF side, we do take counter-trend trades from time to time in commodity based ETFs.
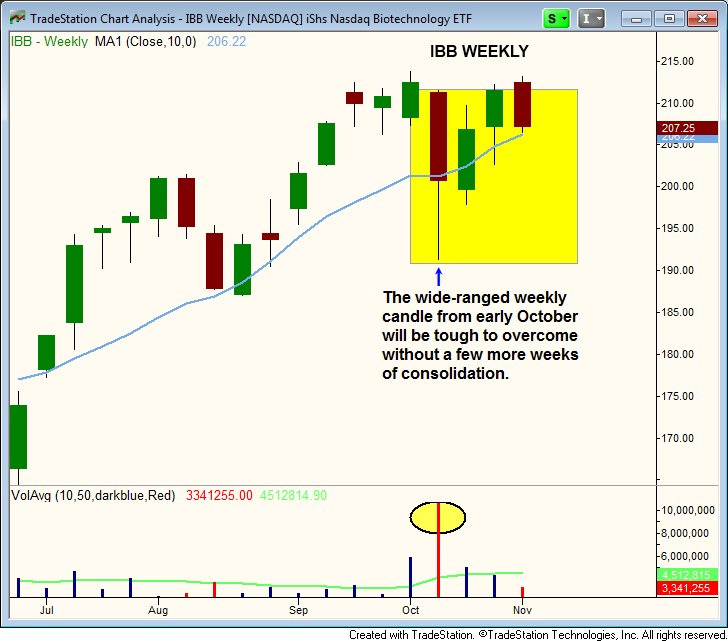
Biotech ETFs have led the market higher the past few years, but have struggled as of late. The iShares NASDAQ Biotechnology ETF ($IBB) sold off on big volume a few weeks ago and sold off on heavy volume again yesterday.
The nasty selling in early October produced a wide-ranged candle on the weekly chart on very heavy volume. This sort of candle usually takes more than a few weeks to digest, so the odds favor $IBB consolidating for a few more weeks before moving higher (if it holds above $200 or so).
On the stock side, $SLCA triggered out tight stop, locking in a 50% gain on the 40% position. The stop in $MELI also triggered for a small gain.
We are selling $YELP at market on the open to lock in profits. $YELP will probably base around for a few more weeks, so we are taking our profits off the table and waiting for a low risk re-entry point to develop.
We are also selling $LOCK on the open, as we feel that the price action is vulnerable to a selloff to the 50-day MA.
$LNKD closed 9% lower, and may head lower again tomorrow if $FB’s reaction to earnings is negative. Our stop is in, so all we can do is wait and see.
We have been patient on the long side the past few weeks, which was tough to do as the S&P was moving higher, but our scans were simply not producing many setups. We will continue to lay low with regard to new positions until clear, low risk buy setups emerge.