market timing model:
Buy-Signal generated on the close of December 31 (click here for more details)
today’s watchlist (potential trade entries):

Having trouble seeing the open positions graphic above? Click here to view it directly on your web browser instead.
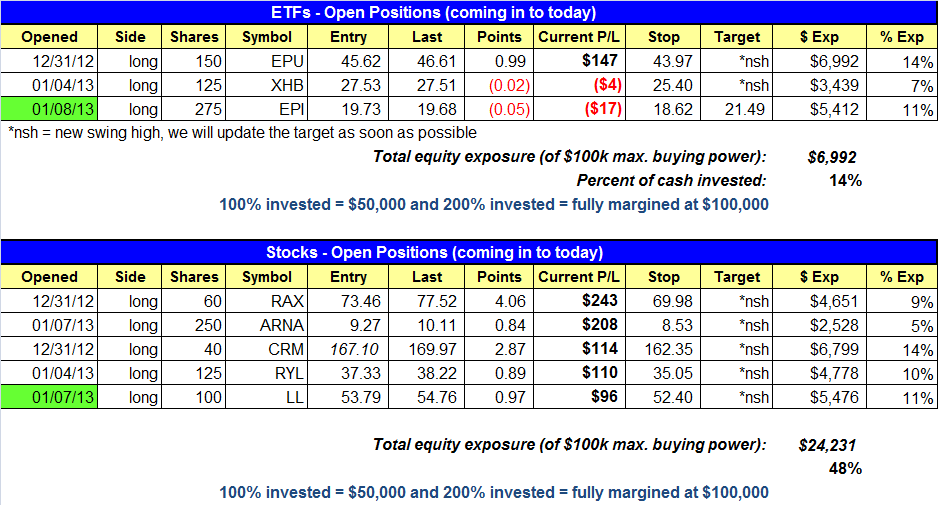
open positions:
Below is an overview of all open positions, as well as a report on all positions that were closed only since the previous day’s newsletter. Net P/L figures are based on two separate $50,000 model portfolios (one for ETFs and one for stocks). Changes to open positions since the previous report are listed in pink shaded cells below. Be sure to read the Wagner Daily subscriber guide for important, automatic rules on trade entries and exits.
Having trouble seeing the open positions graphic above? Click here to view it directly on your web browser instead.
closed positions:

Having trouble seeing the closed positions graphic above? Click here to view it directly on your web browser instead.
ETF position notes:
- $EPI trade triggered. Cancelled $EWS setup.
stock position notes:
- $LL buy entry triggered. Cancelled $OCN buy setup.
ETF, stock, and broad market commentary:
Stocks took a bit of a tumble in the first two hours of trading before stabilizing and moving off the lows in the afternoon. Fortunately for the bulls, there was enough buying interest in the final hour to lift the major averages off the lows of the day and into the top half of the day’s range by the close. For the second day in a row broad market losses were contained to the -0.1% to -0.4% range, but unlike Monday, volume did pick up. The higher volume selling action counts as a distribution day for the S&P 500 and Nasdaq Composite. However, the fact that the market did not close at the lows of the day does take some of the sting out of the distribution.
Tuesday’s distribution is the first sign of trouble in the market since the explosive move off the lows. We have seen too much accumulation in strong stocks to view one distribution day as a problem. However, should more distribution days follow this week that would certainly be cause for concern.
The WisdomTree India Earnings Fund ($EPI) buy setup triggered and we are now long. Although the price action failed to follow through on the open, the push off the lows in the afternoon allowed $EPI to close well off the lows of the day. A move above Tuesday’s high on Wednesday would be ideal. We canceled the $EWS buy setup but we will continue to monitor the action for a low risk entry.
In yesterday’s commentary we mentioned the iShares MSCI Taiwan Index ($EWT) as a potential pullback setup within the next few days. Yesterday’s action in $EWT provides us with a low risk entry point for partial size. We will look to add to the position if the price action moves in our direction. We look for the price action to tighten up over the next few weeks in between the converging downtrend lines while holding above the 50-day MA. Bullish basing patterns should tighten up before they breakout. Trade details can be found in the watchlist section above.

iShares MSCI Malaysia Index Fund ($EWM) recently broke out from a bullish cup and handle pattern. The cup portion of the pattern is the rounded out basing action and the handle portion is the higher right side that forms just below the highs of November. Although we missed the initial breakout, about half of all cup and handle patterns retreat back to the breakout level before taking off. Ideally, we’d like to see $EWM pull back two to three more days and test or undercut the $15.00 level and form some sort of bullish reversal candle.

$LL buy stop triggered on Tuesday and followed through nicely. Rather than looking for two buy entries in $LNKD, we are going with one entry over yesterday’s high with a tight stop. Along with $LNKD, we have two new buy setups in $SWI and $REGN. $SWI’s reversal bar on Tuesday provides us with a low risk entry point and a tight stop.
After two shakeouts below the 20-day EMA the past few days, we feel that $LNKD might be ready to run higher if the action can return back above the 20-day EMA.

If you are a new subscriber, please e-mail [email protected] with any questions regarding our trading strategy, money management, or how to make the most out of this report.
relative strength combo watchlist:
Our Relative Strength Combo Watchlist makes it easy for subscribers to import data into their own scanning software, such as Tradestation, Interactive Brokers, and TC2000. This list is comprised of the strongest stocks (technically and fundamentally) in the market over the past six to 12 months. The scan is updated every Sunday, and this week’s RS Combo Watchlist can be downloaded by logging in to the Members Area of our web site.