Current signal generated on close of July 11.
Portfolio exposure should at least be 75% to 100% long or more (if you can go on margin).
Past signals:
- Neutral signal generated on close of July 5
- Sell signal generated on close of June 24
today’s watchlist (potential trade entries):

Having trouble seeing the open positions graphic above? Click here to view it directly on your web browser instead.
open positions:
Below is an overview of all open positions, as well as a report on all positions that were closed only since the previous day’s newsletter. Changes to open positions since the previous report are listed in pink shaded cells below. Be sure to read the Wagner Daily subscriber guide for important, automatic rules on trade entries and exits. Click here to learn the best way to calculate your share size.

Having trouble seeing the open positions graphic above? Click here to view it directly on your web browser instead.
closed positions:
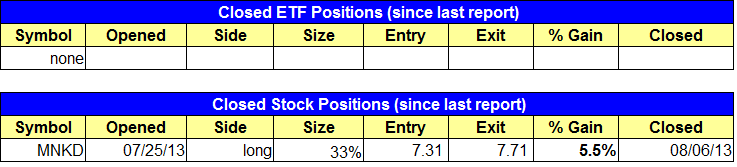
Having trouble seeing the closed positions graphic above? Click here to view it directly on your web browser instead.
ETF position notes:
- $TAN buy setup did not trigger due to 5-minute rule. Please note the new entry price above.
stock position notes:
- $MNKD sell stop triggered, and we are out with a 5% gain.
ETF, stock, and broad market commentary:
A round of institutional selling hit the stock market yesterday, as the major indices substantially declined on higher volume. Both the S&P 500 and Dow Jones Industrial Average fell 0.6%, while the NASDAQ Composite shed 0.7%.
Turnover in the NYSE jumped 23%, as volume in the NASDAQ rose 5% above the previous day’s level. The higher volume losses caused both the S&P and NASDAQ to register a bearish “distribution day” that was indicative of selling among banks, mutual funds, hedge funds, and other institutions.
Although the majority of our stock and ETF positions dipped alongside of the broad market yesterday, we actually would welcome a near-term correction in the main stock market indexes because it would create new potential swing trade pullback entries.
As we have mentioned several times in recent weeks, our ETF scans have been coming up mostly dry because the strongest ETFs have been too extended to provide a positive reward to risk ratio for buy entry. Therefore, a short-lived pullback in the broad market could solve this problem (just as long as leading individual stocks continue to hold up well).
Now, we are currently scanning ETFs with relative strength to put on our radar screen for potential pullback buy entry. One such ETFs is Direxion China Bull 3x ($YINN), an international ETF tied of the performance of the Chinese stock market (and leveraged to move at 3x the underlying securities).
As shown on the weekly chart below, notice that $YINN has just broken out above major resistance of its prior highs from January 2013, after four consecutive weeks of massive gains. Now, the ETF is starting to pull back from its recent parabolic run:

The horizontal line that marks prior resistance of the January 2013 highs should now serve as the new support level on the pullback. However, $YINN will likely “undercut” that support level, which would shake out the “weak hands.”
Next, take a look at the shorter-term daily chart:

Despite the current pullback off the highs, $YINN is still trading above both its 10 and 20-day moving averages. This is a sign of major relative strength.
Since horizontal price support (from the weekly chart) is around the $21.65 and the 10-day moving average is presently at $21.39, we would anticipate a pullback to the $21 – $21.50 area (an “undercut” of support).
Presently, $YINN is not actionable. However, it’s a good one to put one your radar screen. As for entry, we ideally would like to see the formation of a bullish reversal candle coincide with a pullback that undercuts support. If that happens, it would provide us with a low-risk buy entry point above the high of the reversal candle. But for now, we will just have to wait and see how the price action develops.
We have two new setups on today’s watchlist, and both are A rated in $LNKD and $URI. In $LNKD, we are simply buying a 1/3 position at the market on Wednesday’s open with a stop about 5% below othe entry. $LNKD has the potential to run 100% from the last breakout level over the next 6-8 weeks, so our entry is more about just finding a way in rather than looking for a pretty setup.
$URI broke out from a a cup and handle pattern on 7/31. Tuesday’s pullback into support of the rising 10-day MA, short-term uptrend line, and prior breakout level presents us with a low risk entry point. Like $LNKD, we are buying $URI “at the market” on Wednesday’s open. For those not watching the market as it opens, you can set a buy limit order to be filled no higher than $59.00 on $URI and no higher than $237.00 on $LNKD.

Note: You can download the RS+EPS Combo list by logging into the members section of our website.