market timing model:
Confirmed Buy – Signal generated on the close of September 4 (click here for more details)
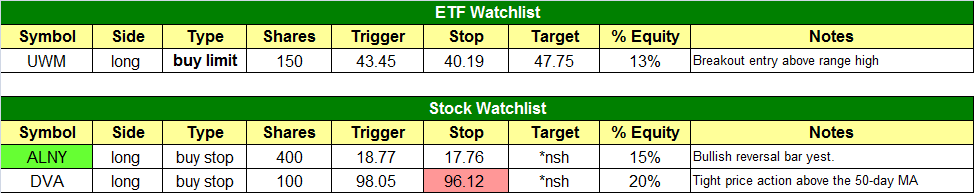
today’s watchlist (potential trade entries):
Having trouble seeing the open positions graphic above? Click here to view it directly on your web browser instead.
open positions:
Below is an overview of all open positions, as well as a report on all positions that were closed only since the previous day’s newsletter. Net P/L figures are based on two separate $50,000 model portfolios (one for ETFs and one for stocks). Changes to open positions since the previous report are listed in pink shaded cells below. Be sure to read the Wagner Daily subscriber guide for important, automatic rules on trade entries and exits.

Having trouble seeing the open positions graphic above? Click here to view it directly on your web browser instead.
closed positions:

Having trouble seeing the closed positions graphic above? Click here to view it directly on your web browser instead.
ETF position notes:
- Please note that the entry in UWM is a buy limit order. The buy limit will trigger on the open as long as the opening price is at or below 43.45. Please cancel the setupif UWM gaps open above 43.45.
stock position notes:
- AFFY add triggered. Note the change to the stop price in DVA.
ETF and broad market commentary:
After opening near the flat line yesterday, stocks sold off in the morning, but afternoon buying interest enabled the main stock market indexes to reverse back up. By the closing bell, major divergence in the broad market caused the major indices to finish with substantially mixed results. The blue-chip Dow Jones Industrial Average ($DJIA) posted a 0.4% loss and the S&P 500 Index ($SPX) edged 0.1% lower. However, small and mid-cap issues showed impressive relative strength yesterday. The small-cap Russell 2000 ($RUT) and S&P MidCap 400 ($MID) rallied 1.2% and 1.1% respectively. The Nasdaq Composite ($COMPQ) registered a more modest gain of 0.3%. The bulls held the upper hand into the close, as stocks closed near their intraday highs.
Like the price action of the broad market, volume levels were mixed as well. Turnover in the NYSE was 6% lower than the previous day’s level, but total volume in the Nasdaq jumped 10%. Although the S&P and Dow posted small losses, the lighter volume in the NYSE enabled the S&P 500 to avert a “distribution day.” On the other hand, the higher volume gain of the Nasdaq enabled the index to score a second consecutive bullish “accumulation day” that was indicative of institutional buying. In both exchanges, advancing volume finished roughly on par with declining volume, which was a solid recovery from the negative market internals of the morning.
Although the closing prices of the main stock market indexes were rather mixed yesterday, make no mistake that it was indeed an overall bullish trading day. For starters, stocks managed to shake off significant morning selling and subsequently recover all the way back to test their intraday highs. Afternoon strength and resilience is a common trait of healthy markets. But even more important was the clear relative strength of small-cap stocks.
Long-time subscribers of this newsletter know that the performance of small and mid-cap stocks plays a significant role in our swing trading strategy for both individual stocksand ETFs. Most of the stocks we buy (only in uptrending markets) are small and mid-cap growth stocks because they have the greatest potential to exhibit sharp upward price momentum in uptrending markets. But even most industry sector ETFs tend to perform better and trend smoother when small and mid-cap stocks are leading the broad market.
The institutional money flow into small-cap stocks yesterday caused iShares Russell 2000 Index ($IWM) to break out above a key level of horizontal price resistance yesterday. Confirming the move was a surge in volume, which shot well above its 50-day average level. The IWM breakout is shown on the daily chart pattern below:

Given the high volume breakout in IWM yesterday, we are now stalking ProShares Ultra Russell 2000 ($UWM) for potential swing trade buy entry going into today’s session. For those not familiar with ProShares ETFs, UWM is simply the 2X leveraged version of IWM. Over longer-term holding periods, most leveraged ETFs usually underperform their non-leveraged siblings. However, the long-term underperformance that arises from daily rebalancing of the portfolios of leveraged ETFs is not much of an issue with the shorter-term, momentum-based trades that we focus on.
If it triggers our entry price entry, buying UWM in our model ETF trading portfolio, rather than IWM, ties up less capital. Still, we will use IWM as the proxy for getting our buy and sell signals for this trade set up, then use corresponding entry and exit prices for trading UWM instead. Please note our detailed entry, stop, and target prices for this new ETF trade setup in the “ETF Watchlist” section above.
All three of our current open ETF positions advanced yesterday. The biggest gainer was iShares Nasdaq Biotechnology ETF ($IBB), which broke out above its recent consolidation and cruised 1.5% higher. The ETF is now testing resistance of its all-time high, which was set on July 27, 2012. Given the increasing volume of this ETF, combined with ongoing relative strength in the healthcare sector, we expect IBB to soon break out to a new record high. Although we have already been holding our initial entry in this ETF for the past three weeks, our patience is starting to pay off. Take a look:

The iPath Grains Trust ($JJG), a commodity ETF we have been long since August 29, rose 0.5% yesterday and continues to exhibit a nice daily chart pattern. On the chart below, notice the bullish “pennant” formation JJG has been forming, while the 20-day exponential moving average (beige line) has been perfectly acting as support. This should eventually lead to a breakout to new highs in the coming days:

DB Gold Double Long ($DGP), a gold ETF we bought when it broke out on August 31, digested the previous days sharp gains, while still managing to rise 0.3%. We expect bullish momentum to carry gold ETFs substantially higher, both in the short term and intermediate-term, but we plan to sell DGP into strength before the first correction occurs, then look to re-enter after it forms a “bull flag” or a base of price consolidation.
stock commentary:
We are keeping DVA on the watchlist and adding one new setup in ALNY, which is a top relative strength biotech stock.

Yesterday’s relative strength in the small and mid-cap arena was a very good sign for the health of the current rally. The two charts below show the jump in the relative strength lines of IWM (small cap ETF) and MDY (mid cap ETF):


The New 52-Week Highs list in the Russell 2000 is also picking up steam:

Our timing model now stands at a confirmed buy signal, which means that market conditions are strong enough to warrant using margin. Rather than running out and buying everything in sight just for the sake of being on margin, we will let the market come to us and build our exposure as setups devleop.
If you are a new subscriber, please e-mail [email protected] with any questions regarding our trading strategy, money management, or how to make the most out of this report.
relative strength combo watchlist:
Our Relative Strength Combo Watchlist makes it easy for subscribers to import data into their own scanning software, such as Tradestation, Interactive Brokers, and TC2000. This list is comprised of the strongest stocks (technically and fundamentally) in the market over the past six to 12 months. The scan is updated every Sunday, and this week’s RS Combo Watchlist can be downloaded by logging in to the Members Area of our web site.