market timing model:
Buy – Signal generated on the close of November 23 (click here for more details)
today’s watchlist (potential trade entries):

Having trouble seeing the open positions graphic above? Click here to view it directly on your web browser instead.
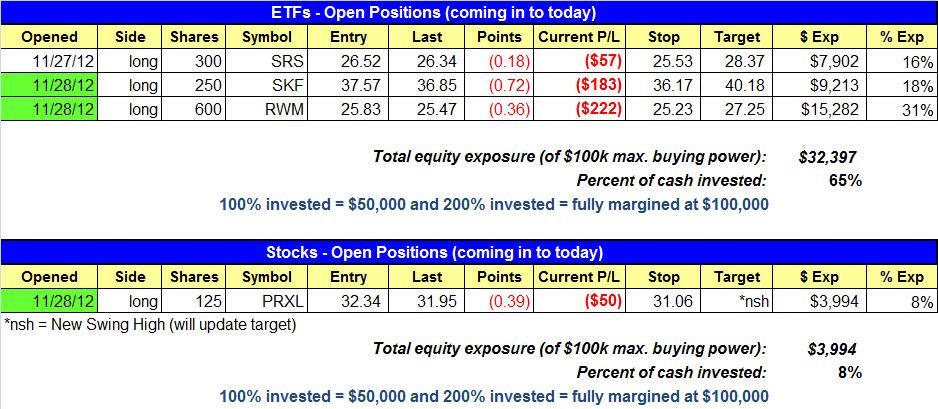
open positions:
Below is an overview of all open positions, as well as a report on all positions that were closed only since the previous day’s newsletter. Net P/L figures are based on two separate $50,000 model portfolios (one for ETFs and one for stocks). Changes to open positions since the previous report are listed in pink shaded cells below. Be sure to read the Wagner Daily subscriber guide for important, automatic rules on trade entries and exits.
Having trouble seeing the open positions graphic above? Click here to view it directly on your web browser instead.
closed positions:

Having trouble seeing the closed positions graphic above?
Click here to view it directly on your web browser instead.
ETF position notes:
- SKF and RWM buy setups triggered on the open.
stock position notes:
- PRXL buy setup triggered.
ETF and broad market commentary:
Initially following through on bearish momentum from the previous day’s weak closing action, stocks opened substantially lower yesterday morning, but a subsequent afternoon recovery enabled the major indices to finish with solid gains. Shaking off their morning losses quickly, the main stock market indexes reversed to the flatline by mid-day, then continued higher right into the close. The S&P 500 ($SPX), Nasdaq Composite ($COMPQ), and Dow Jones Industrial Average each cruised 0.8% higher. The small-cap Russell 2000 ($RUT) and S&P Midcap 400 ($MID) indices both gained 0.7%. As we have frequently seen over the past ten days, the broad-based indices settled at their best levels of the day.
Given yesterday’s bullish price action, it is important to determine whether or not total volume levels confirmed the bullish price action of the reversal day. Because turnover in the NYSE was indeed 2% greater than the previous day’s level, the S&P 500 (barely) registered an “accumulation day,” which was indicative of institutional buying. However, total volume in the Nasdaq actually receded 2%, preventing the tech-heavy index from scoring the same label of a bullish “accumulation day.”
Yesterday’s session could’ve been ugly if prices would have failed to quickly recover from the rather significant morning losses. Yet, such volatile price action was not a surprise to us. Recall that we just said in the previous day’s report that, “the broad market is presently giving overall mixed technical signals.” As such, yesterday’s surprise bullish reversal day, which followed a bearish “distribution day,” was a good example of how the stock market is becoming erratic due to the mixed technical signals. This obviously mandates caution on both sides of the market, such as simply reducing share size in order to reduce risk right now.
Two weeks ago, in the November 14 issue of The Wagner Daily, we initially pointed out the relative strength of iShares China Xinhua 25 Index ($FXI) and said, “Although the main stock market indexes of the USA have been in a downtrend since mid-September, FXI actually started trending higher right as the domestic markets started selling off…and is now in pullback mode.”
In our November 19 ETF analysis, just a few days later, we revisited the chart pattern of $FXI and said that, “very short-term traders only might consider buying FXI if it moves above the November 16 high of $35.88.” Because US stocks had not yet confirmed at least a near-term low had been formed, we passed on “officially” taking this trade setup to our ETF Watchlist. Nevertheless, we still pointed out the trade so that more aggressive, very short-term traders could take advantage of an anticipated “quick pop” is the desired. Fast forwarding to the present, take a look at the updated chart of $FXI below:

Note on the chart when we initially said aggressive traders could buy above the two-day high (circled in pink), due to the relative strength of FXI, a major level of horizontal price support (the blue line), and convergence of the 50 and 200-day moving averages (teal and orange lines respectively). Thereafter, FXI generally trended higher, but not in a very steady fashion.
Yesterday, like most stocks and ETFs in the market, FXI gapped down sharply lower, but reversed to close at its intraday high and back above its 20-day exponential moving average (beige line). This followed a normal four-day pullback from its November 23 high. This has created an ideal pullback buy setup in FXI, which has a positive reward to risk ratio. As noted on our ETF watchlist above, we plan to buy FXI on a rally above yesterday’s high, with a stop just below the 50-day moving average (which is also just below yesterday’s low). Our target price for FXI is a rally to new swing highs, above its prior high from early November. If that occurs, we will then raise our protective stop to lock in gains along the way.
Yesterday, both of our “official” swing trade setups, ProShares Russell 2000 Index ($RWM) and ProShares UltraShort Financials Index ETF ($SKF), triggered for buy entry due to the opening gap down. But since they are both inversely correlated “short ETFs,” they sold off to close below our entry prices. Our only other open ETF position, ProShares UltraShort Real Estate Index ETF ($SRS), actually managed to move higher yesterday. Since we now have plenty of exposure on the short side of the market, FXI will help reduce portfolio risk if it triggers for buy entry.
Although it may be disappointing when new ETF swing trades entered in the morning ($RWM and $SKF) are already showing an unrealized loss by the closing bell, professional traders know that being consistently profitable over the long-term is simply a matter of believing in and following a proven trading system. Experienced traders also don’t worry about whether or not a losing position is going to hit their stop price because they know the business of trading is simply a “numbers game.”
One of my favorite phrases, as it relates to money management and swing trading, is to “set it and forget it.” This means we immediately set a predetermined stop price every time we enter a new trade, and then simply forget about it! The trade either moves in our favor or goes the wrong way and hits the stop. But either way, you will be a more relaxed and less anxious trader if you learn to adopt this “set it and forget it” policy. Furthermore, remember that capital risk can be easily reduced by just lowering share size on new trades (as we have done with each of our past three ETF swing trade entries).
stock commentary:
Our lone buy setup in $PRXL triggered on Wednesday, but failed to follow through on the breakout. It remains a solid setup but may need a day or two of sideways action before breaking out again.
We definitely liked today’s price action, with the only disappointment being the lighter volume on the Nasdaq. Overall, Wednesday’s action was a positive sign for the bulls and a little more evidence that the market is beginning to gain some traction. With a buy signal in place, we are looking to build up to 4-6 long positions with reduced share size (around 7-8% per position). We are not ready to take on more than 30-50% long exposure until conditions improve and/or we book a few winnners.
We have a few new setups for Thursday. First up is $QIHU, which broke above the 11/26 reversal candle high and is a buy entry on Thursday’s open. Please note that we are buying $QIHU “at the market” on Thursday’s open as long as the opening price is not greater than 24.30.

Along with QIHU, we have buy setups in ALJ, NTE and URI. With NTE, we are placing a buy limit order and hopefully we can get filled within the next few days before if/when it runs higher. With ALJ and URI we have our normal buy stop orders in.
If you are a new subscriber, please e-mail [email protected] with any questions regarding our trading strategy, money management, or how to make the most out of this report.
relative strength combo watchlist:
Our Relative Strength Combo Watchlist makes it easy for subscribers to import data into their own scanning software, such as Tradestation, Interactive Brokers, and TC2000. This list is comprised of the strongest stocks (technically and fundamentally) in the market over the past six to 12 months. The scan is updated every Sunday, and this week’s RS Combo Watchlist can be downloaded by logging in to the Members Area of our web site.