market timing model:
Confirmed Buy – Signal generated on the close of September 4 (click here for more details) (we are on a buy signal from the close of Aug. 16)
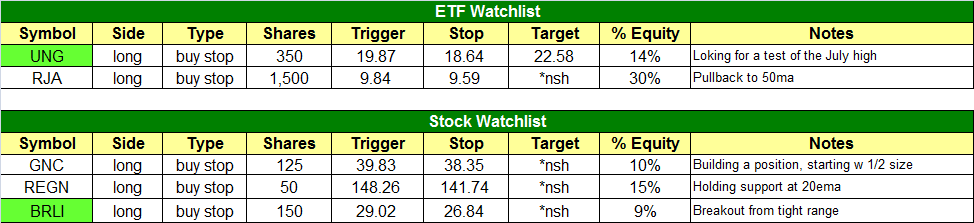
today’s watchlist (potential trade entries):
Having trouble seeing the open positions graphic above? Click here to view it directly on your web browser instead.
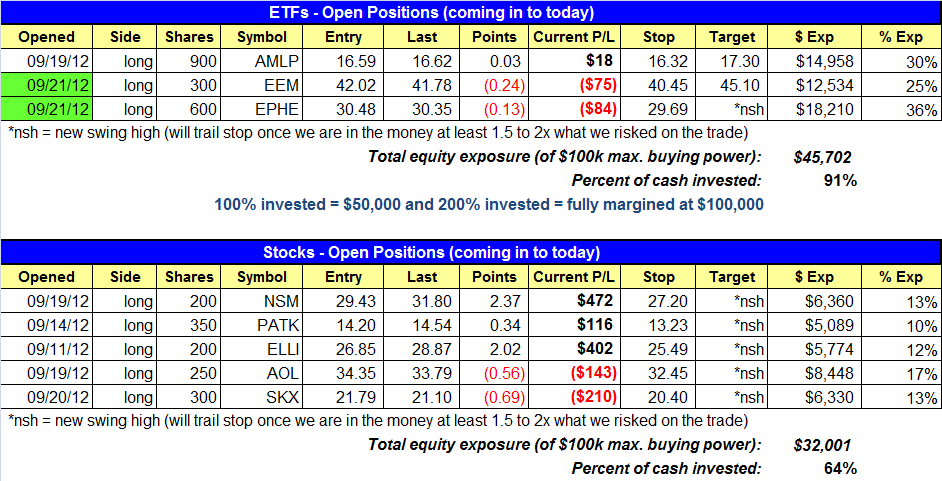
open positions:
Below is an overview of all open positions, as well as a report on all positions that were closed only since the previous day’s newsletter. Net P/L figures are based on two separate $50,000 model portfolios (one for ETFs and one for stocks). Changes to open positions since the previous report are listed in pink shaded cells below. Be sure to read the Wagner Daily subscriber guide for important, automatic rules on trade entries and exits.
Having trouble seeing the open positions graphic above? Click here to view it directly on your web browser instead.
closed positions:

Having trouble seeing the closed positions graphic above? Click here to view it directly on your web browser instead.
ETF position notes:
- EPHE and EEM triggered on the long side.
stock position notes:
- Stopped out of the half sized position in QIHU. We will continue to monitor for a re-entry point.
ETF and broad market commentary:
Initially gapping higher on the open, stocks got off to a positive start last Friday. However, traders sold into the strength of the upward momentum, causing the main stock market indexes to once again closed near unchanged levels. The Nasdaq Composite ($COMPX) edged 0.1% higher, the S&P 500 Index ($SPX) was flat, and the Dow Jones Industrial Average ($DJIA) slipped 0.1%. Relative strength in the small-cap arena enabled the Russell 2000 to gain 0.5%, but the S&P MidCap 400 was unchanged. The main stock market indexes closed at their intraday lows, indicating a lack of buying interest into the close.
Turnover surged higher across the board, but most of the increase in volume could be attributed to the quarterly “quadruple witching” day, in which there was the simultaneous expiration of stock index futures, stock index options, stock options and single stock futures. Total volume in the NYSE rocketed 91% above the previous day’s level. Turnover in the Nasdaq jumped 31%. Obviously, total volume in both exchanges shot way above 50-day average levels. However, the massive surge in volume was not very unusual given that it was a monthly options expiration day, and particularly a “quadruple witching” day. As such, it could be deceiving to read much into the price to volume ratio of the broad market last Friday.
Unlike our stock trading strategy, which focuses primarily on Breakouts and Pullbacks in uptrending markets, we afford ourselves a bit more diversity with our ETF trading strategy because we also seek to take advantage of ETFs reversing from downtrends. This is particularly true with ETFs that have a low correlation to the direction of the broad market, such as currency, commodity, fixed income, and international ETFs. One ETF we are stalking for potential short-term buy entry now is U.S. Natural Gas Fund ($UNG). The technical analysis of the trade setup is shown on the daily chart below:

For trend reversal plays, we typically wait several months after the ETF has formed a significant low, which enables the 20, 50, and 200-day moving averages to each be trending higher and above one another. Buying before that happens often leads to a negative result. However, in the case of UNG, a very important factor driving this setup is the close proximity of the 200-day moving average.
As a long-term indicator of trend, the 200-day moving average usually acts as a brick wall. If an ETF or stock is trying to move above that resistance level, it typically requires at least several attempts. However, when the breakout above the 200-day MA eventually happens, it is normally quite powerful, at least in the near-term.
In the case of UNG, notice it has already pulled back after several attempts to break the 200-day MA, but has formed a “higher low” each time in the process. Odds of a breakout above the 200-day MA are increased after several “higher lows” have already been formed, as is the case with UNG. If it convincingly rallies above its 200-day MA on this attempt, it will probably move sharply higher in the near-term. However, because this ETF is well off its 52-week high, it is NOT a trade setup we want to hold for the long-term. Rather, this is intended to be a very quick, momentum-based “pop” above the 200-day MA. Estimated holding time if it triggers for buy entry is only 2 to 5 days. Subscribers should note our exact trigger, stop, and share size in the ETF Trading Watchlist section above.
Last Friday, two new ETF trades triggered for buy entry. Both iShares Philippines ($EPHE) and iShares Emerging Markets Index ($EEM). Both ETFs demonstrated weak closing price action, but held above their opening gaps. Combined with $AMLP, we now have three open ETF positions in our newsletter. One benefit of our current positions is that each of the three ETF trades have a low direct correlation to the direction of the overall stock market. As such, we are essentially taking less risk, while still maintaining the opportunity for upside profits.
stock commentary:
We have added one new position to the watchlist in BRLI, which is consolidating in a tight range after a few weeks of wide and loose, “shakeout” action in late August. The price action has settled in to a tight range above the 20 and 50-day MAs. The buy entry is over the current range high. Our stop is about 7% away below the reversal bar of 9/13. If BRLI does not breakout right away then we could see a lower risk entry point develop on a test of the 20-day EMA.
. 
Although we had a few stop outs during the week our trade stats are still positive for the month, showing about a $1,700 gain. We’ve had 5 winners and 6 losers (not counting scratches), with the average winner about two times the average loser. The accuracy rate (batting average) for the month has been a bit lower than I would have liked. This is due to me being slightly impatient with entries in QIHU and ALLT, as well as just some bad luck in QCOR and ACAT. Overall, our system is doing well and our stats are more than acceptable. Despite what many new traders think, a high batting average does not always result in a profitable trading system. Those who strive for high accuracy rates when trading usually hate to lose and are more concerned with being right than making money. Making money in swing trading is all about how much you make when you are right and how little you lose when you are wrong.
If you are a new subscriber, please e-mail [email protected] with any questions regarding our trading strategy, money management, or how to make the most out of this report.
relative strength combo watchlist:
Our Relative Strength Combo Watchlist makes it easy for subscribers to import data into their own scanning software, such as Tradestation, Interactive Brokers, and TC2000. This list is comprised of the strongest stocks (technically and fundamentally) in the market over the past six to 12 months. The scan is updated every Sunday, and this week’s RS Combo Watchlist can be downloaded by logging in to the Members Area of our web site.