market timing model:
Buy – Signal generated on the close of August 16 (click here for more details)
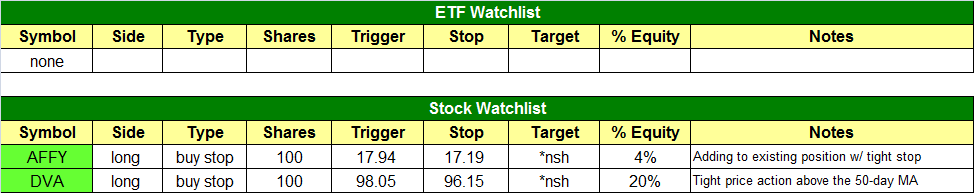
today’s watchlist (potential trade entries):
Having trouble seeing the open positions graphic above? Click here to view it directly on your web browser instead.
open positions:
Below is an overview of all open positions, as well as a report on all positions that were closed only since the previous day’s newsletter. Net P/L figures are based on two separate $50,000 model portfolios (one for ETFs and one for stocks). Changes to open positions since the previous report are listed in pink shaded cells below. Be sure to read the Wagner Daily subscriber guide for important, automatic rules on trade entries and exits.

Having trouble seeing the open positions graphic above? Click here to view it directly on your web browser instead.
closed positions:

Having trouble seeing the closed positions graphic above? Click here to view it directly on your web browser instead.
ETF position notes:
- DGP buy entry triggered.
stock position notes:
- DVA is back on the watchlist. We are also adding to AFFY with a tight stop.
ETF and broad market commentary:
Stocks ended a choppy, indecisive week on a positive note last Friday, as a volatile session led to higher volume gains across the board. As is typically the case when the Fed speaks, stocks whipsawed in both directions following the initial reaction to Ben Bernanke’s presentation in Jackson Hole, but the bulls finished with the upper hand. The S&P 500 Index ($SPX) gained 0.5%, the Nasdaq Composite ($COMPQ) rose 0.6%, and the Dow Jones Industrial Average ($DJIA) climbed 0.7%. The small-cap Russell 2000 ($RUT) and S&P Midcap 400 Index ($MID) advanced 0.4% and 0.5% respectively. As was the case in the majority of last week’s trading sessions, the main stock market indexes closed near the middle of their intraday ranges.
Although volume is typically light ahead of a three-day holiday weekend, turnover was substantially higher last Friday due to the passing of the highly anticipated Jackson Hole meeting. Total volume in the NYSE rose 14% above the previous day’s level, while volume in the Nasdaq similarly increased 13%. Much of the higher trade was attributed to a substantial volume spike in the last 15 minutes of trading. The higher turnover in both exchanges, combined with gains in the S&P and Nasdaq, caused both the NYSE and Nasdaq to register a bullish “accumulation day” that was indicative of participation by banks, mutual funds, hedge funds, and other institutional traders. Despite the choppy intraday price action, solid market internals confirmed the institutional buying. In the NYSE, advancing volume exceeded declining volume by a margin of nearly 3 to 1. The Nasdaq adv/dec ADV/DEC volume ratio was positive by just under 2 to 1.
Throughout the latter half of last week, we were stalking DB Gold Double Long ($DGP), a gold ETF that is a leveraged version of the popular SPDR Gold Trust ($GLD), for potential buy entry (subscribers may want to log in to the Members Area and review our August 27 newsletter for our initial trade analysis, as well as the August 29 issue for follow-up analysis). Going into last Friday’s session, DGP was listed on our ETF watchlist as a potential swing trade buy entry, just above the high of the previous day (August 30), which also converged with the 200-day moving average. Gapping higher on the open, DGP quickly triggered our buy entry, violently reversed all the way back down to just below the previous day’s low, then headed back up again. Ultimately, this wild intraday price action was a “shakeout” that absorbed overhead supply (resistance), and enabled DGP to more easily move higher in the afternoon.
Admittedly, it was a rough start to the morning, as $DGP initially plunged to nearly hit our protective stop price shortly after buy entry (Fed days are always tricky to trade). However, we stuck to the plan of our initial stop price and, less than one hour later, DGP had turned tail and rallied to a new intraday high. Thereafter, it rocketed higher in the afternoon and never looked back. When the (gold) dust had settled, DGP concluded the day with an impressive 4.3% gain, positioning itself for further upside momentum in the near-term.
On the daily chart of DGP below, notice that the ETF has now convincingly broken out above resistance of its 200-day moving average (orange line), and is following through to the upside of its “bull flag” pattern (channeling blue lines) that we pointed out in our August 29 technical anlaysis of DGP:
")
Taking an updated look at the long-term monthly chart pattern of DGP, notice that it has also broken out above resistance of its downtrend line that began with to September 2011 high. This indicates that the one-year correction within its six-year uptrend may be finished. If it is, spot gold and DGP may now be ready to resume its dominant, long-term uptrend. Remember the longer a trend has been in place, the more likely the dominant trend will remain intact:
")
With our ideal entry price of $52.16 on August 31, just above convergence of the 200-day moving average and the August 30 high, this ETF swing trade is already showing anunrealized gain of 3% on the first day of entry. Now that DGP (and spot gold) has broken out above a key area of price resistance, we anticipate bullish momentum to carry DGP substantially higher, both in the near and intermediate-term.
With a price target of $56.80, we bought DGP with the intention of it simply being a short-term, momentum driven swing trade. Given the strength and high volume this gold ETF showed last Friday, DGP may actually rally to our target price rather quickly. If and when it does, we will automatically sell into strength to lock in a quick gain of nearly 9% on the trade. However, this does NOT mean we expect the gold breakout and rally to conclude when we sell. Rather, we simply anticipate a normal price retracement to occur near that level.
If a pullback forms when DGP takes a rest, it may result in the formation of another “bull flag,” or perhaps a multi-week price consolidation, before DGP attempts to resume its newfound upside momentum. Since most of our swing trades are of a short-term nature, we prefer to simply wait for the next low-risk entry point to re-enter the trade, rather than sitting through a pullback or lengthy price consolidation. Nevertheless, intermediate-term traders may be comfortable sitting through a healthy price corection, and there is nothing wrong with that approach either. It’s just a matter of one’s personal risk tolerance, and we usually err to the conservative side when it comes to profit taking with ETF trading.
Over the weekend, we received an e-mail from a subscriber asking if buying a silver ETF (such as $SLV) was possibly a better trade right now than being long a gold ETF ($GLD or $DGP). Although spot silver has indeed been showing relative strength to gold over the past several weeks, we still prefer a play on the gold ETF right now because the longer-term (weekly and monthly) charts show less overhead resistance than with the silver ETFs. In tomorrow’s newsletter, we will dive into that in more detail, along with a couple annotated charts of gold and silver for comparison.
As for the overall broad market, we were encouraged by last Friday’s “accumulation day,” which should set a positive tone to the start of trading in this holiday-shortened week. Most of our other open positions (both ETFs and stocks) are looking pretty good now as well, and should be primed to rally higher if the main stock market indexes cooperate.
stock commentary:
We plan to add to our position in AFFY with a very tight stop (on shares added only) on a breakout above the range high. We may also raise the stop on existing shares if AFFY pulls back and forms a reversal bar off the 20-day EMA.

DVA is back on the watchlist. It is our largest position at 20% due to its weak ATR (Average True Range). To gauge a stocks volatility we use a simple formula called the “ATR to Price Ratio”. Which is a stocks closing price divided by the 20-period ATR. So if a stock closed at $40 with a 20-day ATR of $1 it has a 40 to 1 ratio (which is good). Anything in the 25-45 range is decent. A stock that trades 20x its ATR or less is extremely volatile and one that trades 60x its ATR is too slow. DVA is definitely one of the slower movers and that is why we can stuff the portfolio with a 20% position and still only risk $200 on the trade. As I have mentioned in the past, in order to optimize performance we prefer to trade stocks with more volatility but having one two slower movers out of 8-10 stocks is ok.
If you are a new subscriber, please e-mail [email protected] with any questions regarding our trading strategy, money management, or how to make the most out of this report.
relative strength combo watchlist:
Our Relative Strength Combo Watchlist makes it easy for subscribers to import data into their own scanning software, such as Tradestation, Interactive Brokers, and TC2000. This list is comprised of the strongest stocks (technically and fundamentally) in the market over the past six to 12 months. The scan is updated every Sunday, and this week’s RS Combo Watchlist can be downloaded by logging in to the Members Area of our web site.