market timing model:
Buy – Signal generated on the close of August 16 (click here for more details)
today’s watchlist (potential trade entries):

Having trouble seeing the open positions graphic above? Click here to view it directly on your web browser instead.
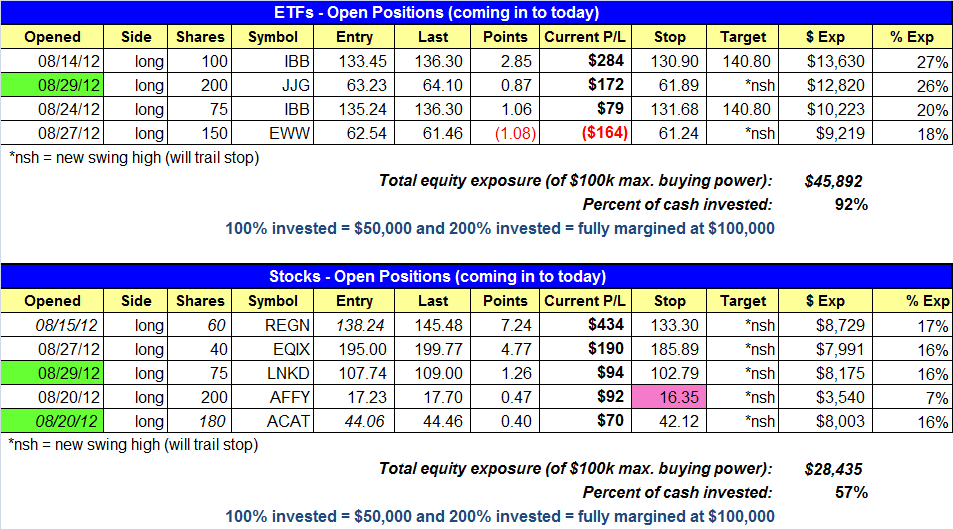
open positions:
Below is an overview of all open positions, as well as a report on all positions that were closed only since the previous day’s newsletter. Net P/L figures are based on two separate $50,000 model portfolios (one for ETFs and one for stocks). Changes to open positions since the previous report are listed in pink shaded cells below. Be sure to read the Wagner Daily subscriber guide for important, automatic rules on trade entries and exits.
Having trouble seeing the open positions graphic above? Click here to view it directly on your web browser instead.
closed positions:

Having trouble seeing the closed positions graphic above? Click here to view it directly on your web browser instead.
ETF position notes:
- JJG triggered for buy entry from yesterday’s watchlist, and is off to a great start so far.
- DGP pulled back, and therefore did not trigger for buy entry above its four-day high. However, this is a good thing because it now provides us with a lower risk entry point above yesterday’s high, with a more clearly defined stop price below the low. On the watchlist above, note the adjusted trigger and stop prices for the DGP setup.
stock position notes:
- ACAT buy entry to add 30 shares triggered. We now have 180 shares with a new average price. We also averaged the price on REGN (40 shares + 20 shares), which we did not do earlier in the week.
- LNKD buy entry triggered.
- Canceled the BIIB buy setup. We are monitoring ALXN or ONXX for a low risk entry point instead. We prefer the earnings momentum in ALXN and the higher relative strength in ONXX over BIIB.
ETF and broad market commentary:
Yesterday was pretty much a clone of every other day this week. Liking the punch of significant volume, stocks bobbed and weaved in a noncommittal fashion throughout the entire session before finishing near the flatline. Both the S&P 500 ($SPX) and Nasdaq Composite ($COMPQ) edged 0.1% higher, while the Dow Jones Industrial Average ($DJIA) was unchanged. Small caps continue to show a bit of life, as the Russell 2000 Index ($RUT) increased 0.4%. The S&P MidCap 400 was higher by 0.1%. Like the previous day, the main stock market indexes unenthusiastically closed near the middle of their intraday ranges.
Total volume in the NYSE was on par with the previous day’s level. Turnover in the Nasdaq was 6% lighter. Again, trade remained below 50-day average levels. The last time volume in the NYSE exceeded its 50-day average level was on August 3. In both exchanges, advancing volume marginally exceeded declining volume, but it was nothing to write home about. As we approach this weekend’s three-day holiday, we don’t expect to see the return of institutional trading until at least next week.
In the August 21 issue of The Wagner Daily (subscribers may log into the online archives to review it), we pointed out that the S&P 500 and Nasdaq indices had run into pivotal resistance of their four-year highs. That they, we suggested that at least a near-term pullback would likely occur before these indexes broke out to new highs. So far, that is exactly what is happening. Let’s take an updated look at what has occurred in both indexes since then. Below is a the daily chart pattern of S&P 500 SPDR (SPY), a popular ETF proxy that tracks the S&P 500:

Notice how $SPY “overcut” horizontal price resistance of its high on August 21, then subsequently pullback to near-term support of its 20-day exponential moving average. On August 24, the index perfectly bounced off its 20-day exponential moving average, and has been chopping around in a tight, sideways range since then. Next, let’s assess the price action of PowerShares QQQ Trust ($QQQ), the well-known ETF that follows the performance of the large-cap Nasdaq 100 Index (the brother of the broader-based Nasdaq Composite):

Like $SPY, $QQQ also probed above resistance of its high on August 21, and then retraced slightly lower. However, notice that $QQQ has been showing slight relative strength to $SPY because it never even pulled back to touch its 20-day exponential moving average, and still just a kiss away from breaking out to refresh high.
With most market participants sitting on the sidelines or on vacation right now, we do not anticipate any substantial price action to occur in the broad market until at least the passing of the Labor Day holiday. Furthermore, any significant price movement that does occur within the next two days is not to be trusted if it occurs on lethargic volume. For that reason, we are not targeting any new ETFs for potential trade entry today.
NOTE: Tomorrow’s (August 31) newsletter will be an abbreviated version without ETF and broad market commentary. We will, however, still send the report with any changes to open positions or trade setups on the watchlist. On Monday, August 3, the US stock markets will be closed for the Labor Day holiday. As such, The Wagner Daily will not be published that day, but regular publication will resume on August 4.
stock commentary:
DVA has formed a bullish, two month consolidation pattern after breaking out above 90.00. We like the tight price action above the 50-day MA the past few days and yesterday’s dry up in volume. We are placing DVA on the watchlist.

If you are a new subscriber, please e-mail [email protected] with any questions regarding our trading strategy, money management, or how to make the most out of this report.
relative strength combo watchlist:
Our Relative Strength Combo Watchlist makes it easy for subscribers to import data into their own scanning software, such as Tradestation, Interactive Brokers, and TC2000. This list is comprised of the strongest stocks (technically and fundamentally) in the market over the past six to 12 months. The scan is updated every Sunday, and this week’s RS Combo Watchlist can be downloaded by logging in to the Members Area of our web site.