Past signals:
- Sell signal generated on close of February 3.
- Neutral signal generated on close of January 24.
- Buy signal generated on close of November 13
- Buy signal generated on close of September 9
- Neutral signal generated on close of August 15
- Buy signal generated on close of July 11
- Neutral signal generated on close of July 5
- Sell signal generated on close of June 24
today’s watchlist (potential trade entries):

Having trouble seeing the open positions graphic above? Click here to view it directly on your web browser instead.
open positions:
Below is an overview of all open positions, as well as a report on all positions that were closed only since the previous day’s newsletter. Changes to open positions since the previous report are listed in pink shaded cells below. Be sure to read the Wagner Daily subscriber guide for important, automatic rules on trade entries and exits.

Having trouble seeing the open positions graphic above? Click here to view it directly on your web browser instead.
closed positions:
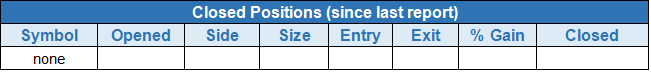
Having trouble seeing the closed positions graphic above? Click here to view it directly on your web browser instead.
ETF position notes:
- No trades were made.
stock position notes:
- No trades were made.
ETF, stock, and broad market commentary:
The market extended about 1.0% higher in the morning session, highlighted by a breakout to new 52-week highs in the S&P 500 and Midcap S&P 400. However, a late session selloff forced most averages to retreat well off the highs of the session and close near the mid-point of the day’s range.
Stocks continue to push higher despite 1) overbought market conditions and 2) ugly V-shaped patterns from a sharp selloff and equally sharp rally. When market conditions remain overbought without much of a pullback it is typically a sign of strength.
Emerging Markets ETF ($EEM) has rallied into resistance from a broken uptrend line and a declining 50-day MA. Tuesday’s price action stalled above 39.70 for the second time in two weeks. There is also resistance from a prior swing low in mid-January at $40.
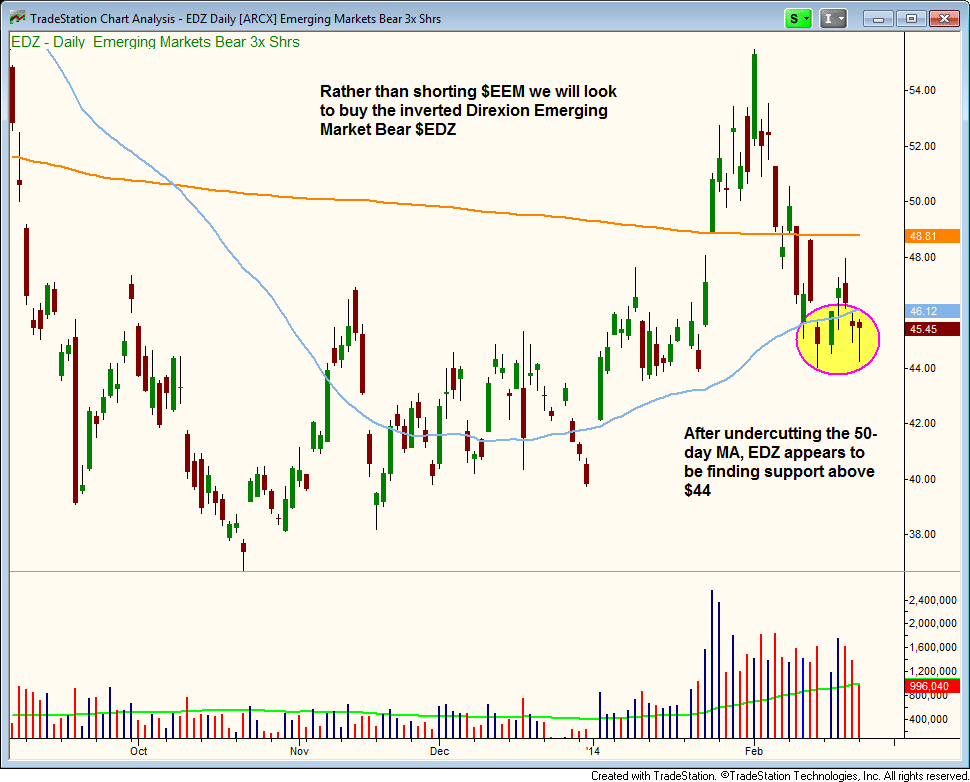
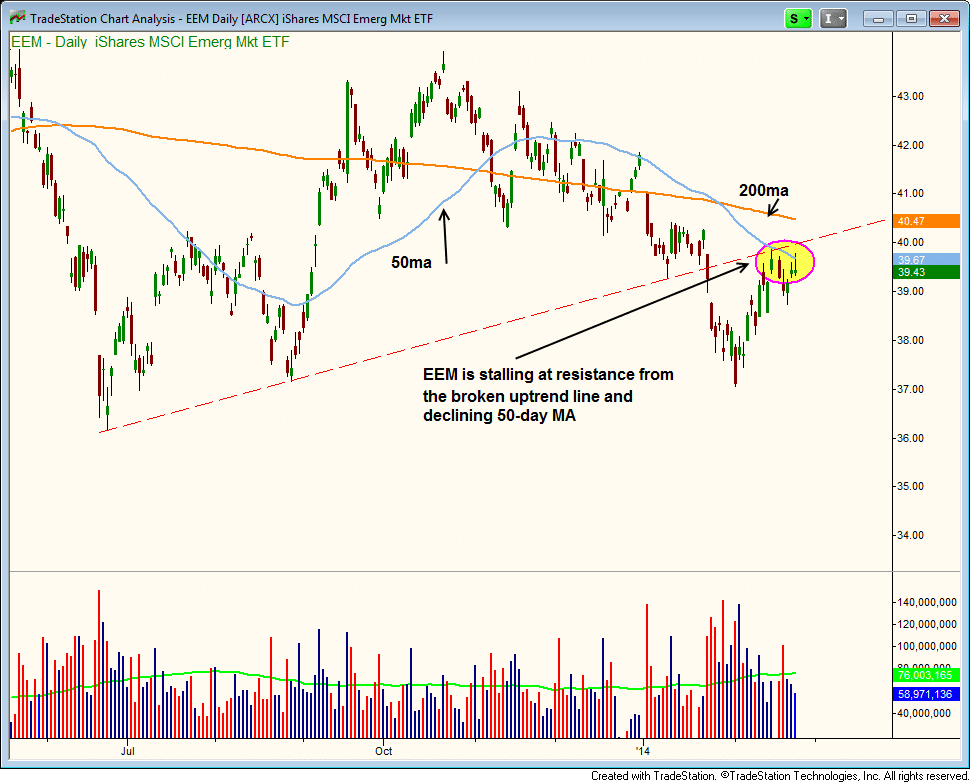 The stalling action at the 50-day MA presents us with a low risk entry point on the short side. However, rather than shorting $EEM we will look to buy the inverted Direxion Emerging Market Bear ($EDZ), which is a 3x leveraged ETF.
Trade details can be found in the watchlist section above.
After breaking down below a key swing low in January, $TBT failed to follow through to the downside and formed a bullish reversal candle during the week of February 7. The false breakdown and reversal formed a double bottom like pattern with an undercut on the weekly chart below. If the price action can clear $73, then $TBT might be ready to rip higher over the next several weeks.

On the stock side, we continue to stalk $IRBT for an entry on weakness with a buy limit order just above the rising 10-day MA
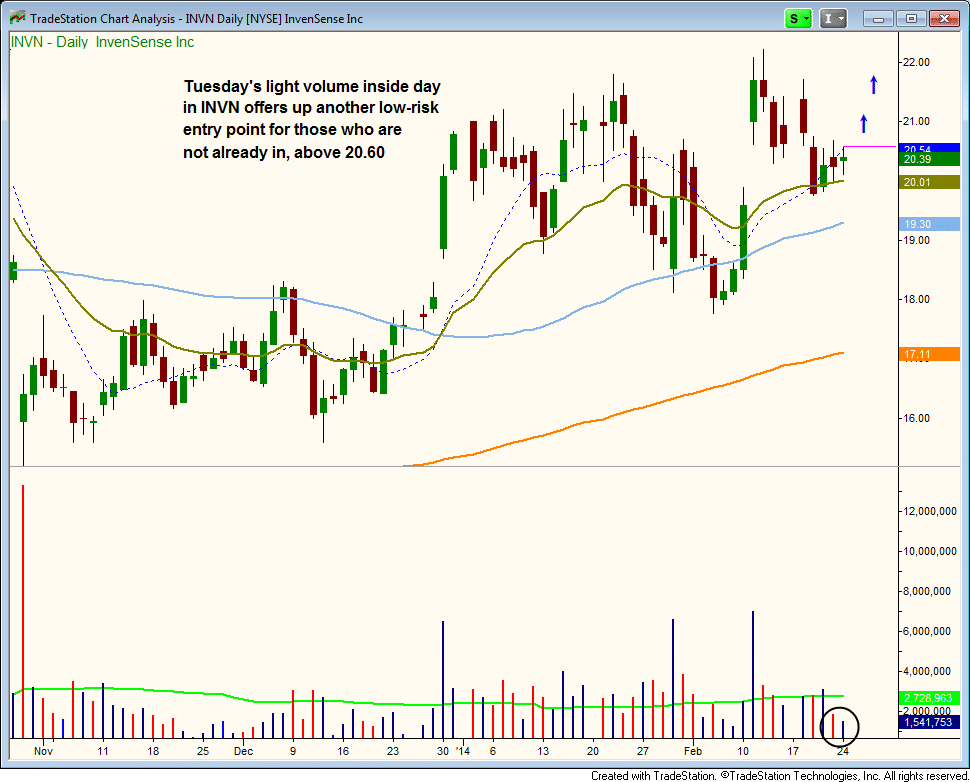
For those who missed our initial entry point in $INVN, yesterday’s light volume, inside day offers a second low-risk entry point at support from the 10 and 20-day MAs. The entry is over Tuesday’s high using the stop we already have in place in the open positions section.
 $SCTY failed to report earnings after the close, but is scheduled to report….again…on March 3. As long as the price action holds the 50-day MA ,then we will continue to hold. A heavy volume break of the 50-day MA will force us to exit.