Current signal generated on close of June 24
Past signals:
- Neutral signal on the close of June 20
- Buy signal on the close of June 13
- Neutral signal on close of June 12
- Buy signal on the close of April 30
today’s watchlist (potential trade entries):

Having trouble seeing the open positions graphic above? Click here to view it directly on your web browser instead.
open positions:
Below is an overview of all open positions, as well as a report on all positions that were closed only since the previous day’s newsletter. Net P/L figures are based a $100,000 model portfolio. Changes to open positions since the previous report are listed in pink shaded cells below. Be sure to read the Wagner Daily subscriber guide for important, automatic rules on trade entries and exits.

Having trouble seeing the open positions graphic above? Click here to view it directly on your web browser instead.
closed positions:

Having trouble seeing the closed positions graphic above? Click here to view it directly on your web browser instead.
ETF position notes:
- No trades were made.
stock position notes:
- No trades were made.
ETF, stock, and broad market commentary:
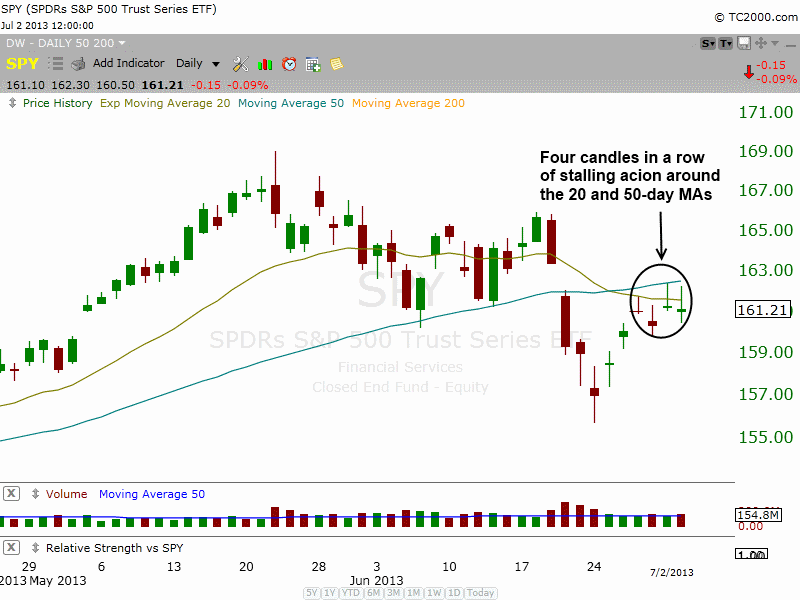
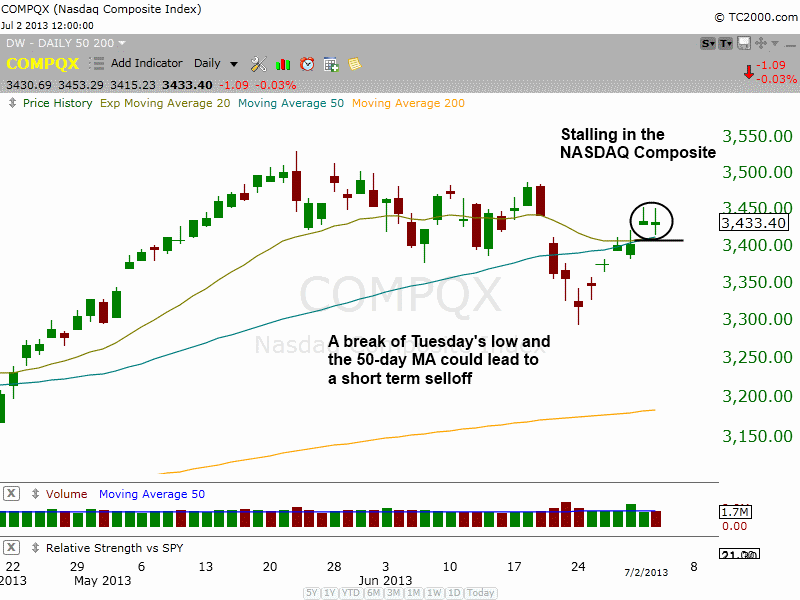
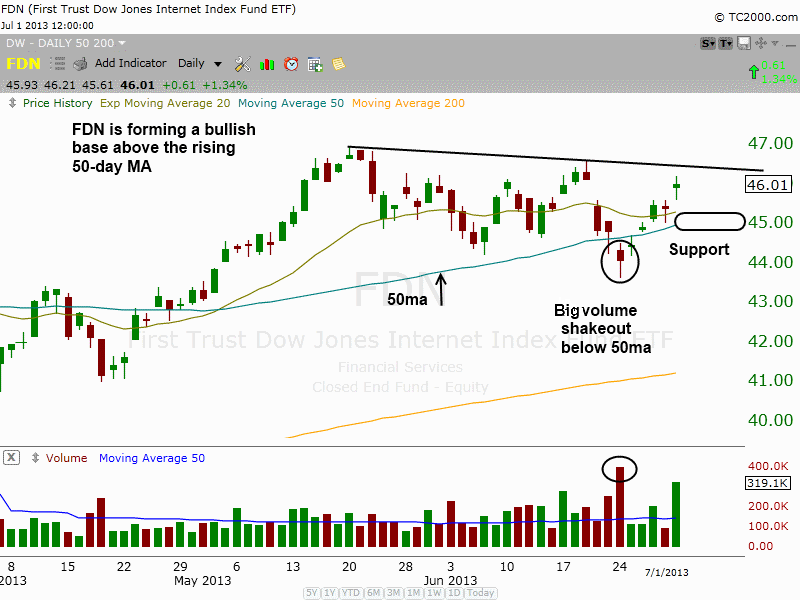
Stocks sold off into the close once again, with the S&P 500 stalling at the 50-day MA for the third time in four sessions. Total volume picked up, but losses were limited to to less than -0.1% on the S&P 500 and NASDAQ, so it was not a clear cut distribution day (but an ugly day nonetheless). After multiple days of stalling action in the major averages, we expect some sort of pullback to develop by next week. Because leadership stocks have held up, we believe that any pullback will be short lived. However, if leading stocks begin to crack with the market, then we will begin to test the waters on the sort side.
Multiple days of stalling action at resistance does not look good:


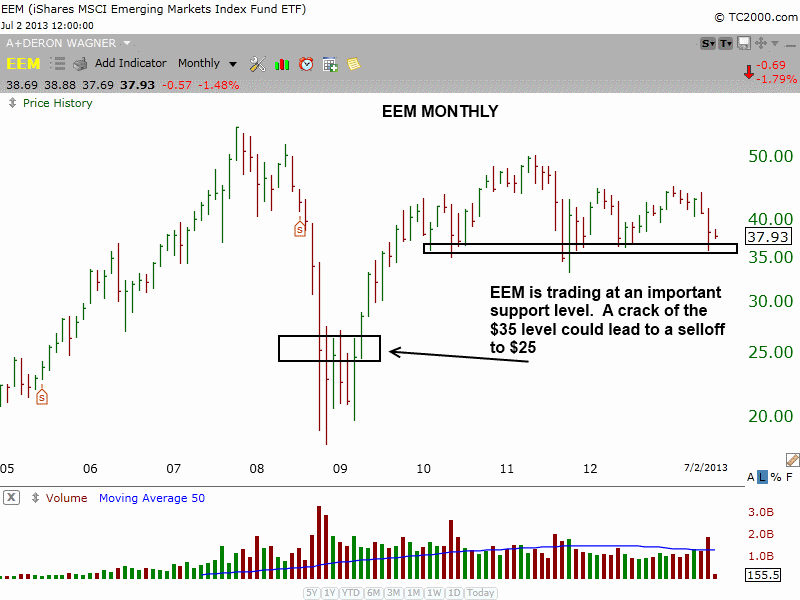
Money continues to rotate out of emerging markets, resulting in iShares MSCI Emerging Markets ETF ($EEM) selling off to an important support level at $35 on the monthly chart below.

A break of this level could lead to a test of the bottoming pattern in 2009, around $25. This pattern is not actionable right now, as $EEM is already a bit extended after a two month selloff. The setup could be in play down the road if $EEM trades in a tight range near $35 while market conditions weaken.
