market timing model:
Sell – Signal generated on the close of October 12 (click here for more details)
today’s watchlist (potential trade entries):
Having trouble seeing the open positions graphic above? Click here to view it directly on your web browser instead.
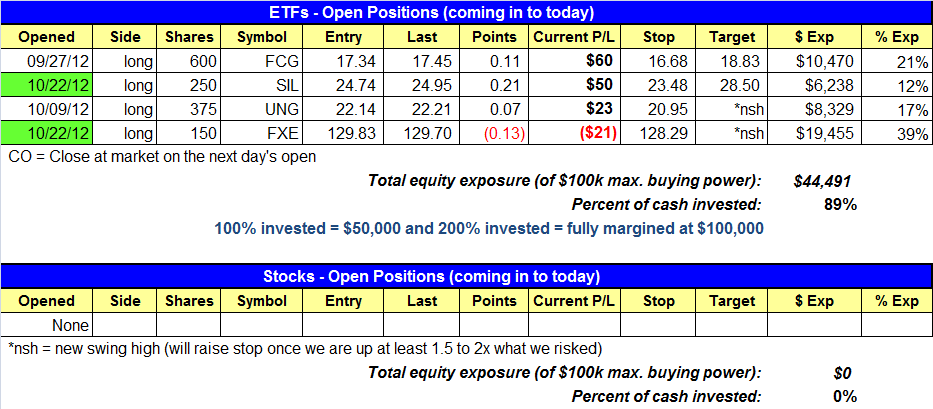
open positions:
Below is an overview of all open positions, as well as a report on all positions that were closed only since the previous day’s newsletter. Net P/L figures are based on two separate $50,000 model portfolios (one for ETFs and one for stocks). Changes to open positions since the previous report are listed in pink shaded cells below. Be sure to read the Wagner Daily subscriber guide for important, automatic rules on trade entries and exits.
Having trouble seeing the open positions graphic above? Click here to view it directly on your web browser instead.
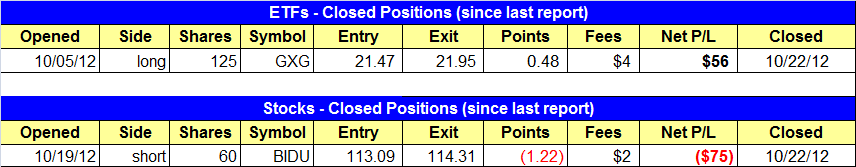
closed positions:
Having trouble seeing the closed positions graphic above? Click here to view it directly on your web browser instead.
ETF position notes:
- SIL and FXE buy entries triggered. Sold GXG for a small gain on the open.
stock position notes:
- Stopped out of BIDU for a small loss.
ETF and broad market commentary:
After opening relatively flat, stocks built on bearish momentum of the previous day’s losses by trending lower throughout most of the day. However, buyers stepped in during the final 90 minutes of trading lifted the major indices back towards their intraday highs. Gaining 0.4%, the Nasdaq Composite ($COMPX) recovered a small portion of last Friday’s loss, but both the S&P 500 Index ($SPX) and Dow Jones Industrial Average ($DJIA) merely finished flat on the day. The small-cap Russell 2000 Index ($RUT) and S&P Midcap 400 Index ($MID) edged lower by 0.1% and 0.2% respectively. Although only the Nasdaq managed to settle on higher ground, it was positive that the main stock market indexes closed near their best levels of the day.
Turnover eased substantially from the previous day’s rather active session. Total volume in the NYSE was 30% lighter than the previous day’s level, while volume in the Nasdaq similarly receded 26%. In both exchanges, advancing volume was roughly on par with declining volume. Given the bullish intraday reversal pattern that formed on the major indices, higher volume would’ve been more encouraging because it would have indicated the presence of institutional buying. Nevertheless, we observed that volume picked up slightly in the final hour of trading.
Over the past week, we have been noticing an interesting and notable divergence between the performance of U.S. broad-based ETFs and select emerging markets ETFs. The PowerShares QQQ Trust ($QQQ), which tracks the Nasdaq 100 Index, has convincingly broken down below key intermediate-term support of its 50-day moving average and is technically in bad shape. However, the iShares Emerging Market Index ($EEM) has been consolidating in a tight, sideways range during the same period, and also formed a “higher low” within its base of consolidation. With a little help from a bounce in the broad market, EEM will likely break out above the highs of its range and start making another leg higher. The daily chart of EEM below illustrates this:

Looking at the longer-term weekly chart of EEM, notice that the consolidation on the daily chart follows a recent breakout above resistance of an 18-month downtrend line, which should now act as the new support level:

Of the various countries that comprise this emerging markets ETF, one of the best looking country-specific ETFs is iShares Hong Kong ($EWH). As shown on the daily chart below, notice that EWH has been neatly holding near-term support of its 20-day exponential moving average, and is now poised for a breakout to a fresh 52-week high:

When an ETF has so much relative strength that it simply trades in a tight, sideways range while the rest of the broad market is trending lower, it clearly indicates a lack of selling interest. As such, it doesn’t take a lot of buying interest in the broad market to subsequently move the ETF higher. Therefore, both EEM and EWH are potential buy candidates if they rally above their respective horizontal price resistance levels. This could easily happen as soon as we see the first decent bounce in the U.S. markets.
As we mentioned yesterday, we presently have the choice of being short, buying inversely correlated “short ETFs,” or trading ETFs with a low correlation to the direction of the broad market. Since these are international ETFs, there is a low correlation to the direction of our domestic markets. Accordingly, both EEM and EWH could be considered for potential buy entry IF they trade above their trigger prices, despite the recent “sell” signal on our market timing model. EWH is probably the better choice of the two because it is poised to breakout to a new 52-week high. Nevertheless, we are not yet listing either ETF as an “official” trade setup because we first prefer to see at least a bit of broad market stabilization, which would reduce the odds of a false breakout if these ETFs attempt to move to new “swing highs.”
stock commentary:
With our market timing model in sell mode the short-term plan is to remain in cash and wait for low-risk short setups to emerge. We did notice a few bullish chart patterns such as SLW, CDE, MDC, BAC, TOL, TEX, MTH, CHS, AGU, AVD, and WHR. However, trading from the long side with little to no help from the broad market is extremely tough to pull off. Silver stocks SLW and CDE might offer the best reward to risk out there on the long side (which is why SIL is in the ETF portfolio), but overall, this is a tough market to get busy on the long side.
For those who are new to trading or new to running a disciplined system, there will be a few times a year when there simply isn’t much to do. When this happens there is no need to force the issue. If you are keeping track of your trade stats (and I know you are), then you should be able to review these periods when you should have done very little and analyze each trade taken. Did you really have a good reason to put the trade on or were you simply trading because you were bored? Are you taking setups outside of your methodology just to satisfy the urge to do something? We plan to keep disciplined and wait for our pitch.
If you are a new subscriber, please e-mail [email protected] with any questions regarding our trading strategy, money management, or how to make the most out of this report.
relative strength combo watchlist:
Our Relative Strength Combo Watchlist makes it easy for subscribers to import data into their own scanning software, such as Tradestation, Interactive Brokers, and TC2000. This list is comprised of the strongest stocks (technically and fundamentally) in the market over the past six to 12 months. The scan is updated every Sunday, and this week’s RS Combo Watchlist can be downloaded by logging in to the Members Area of our web site.